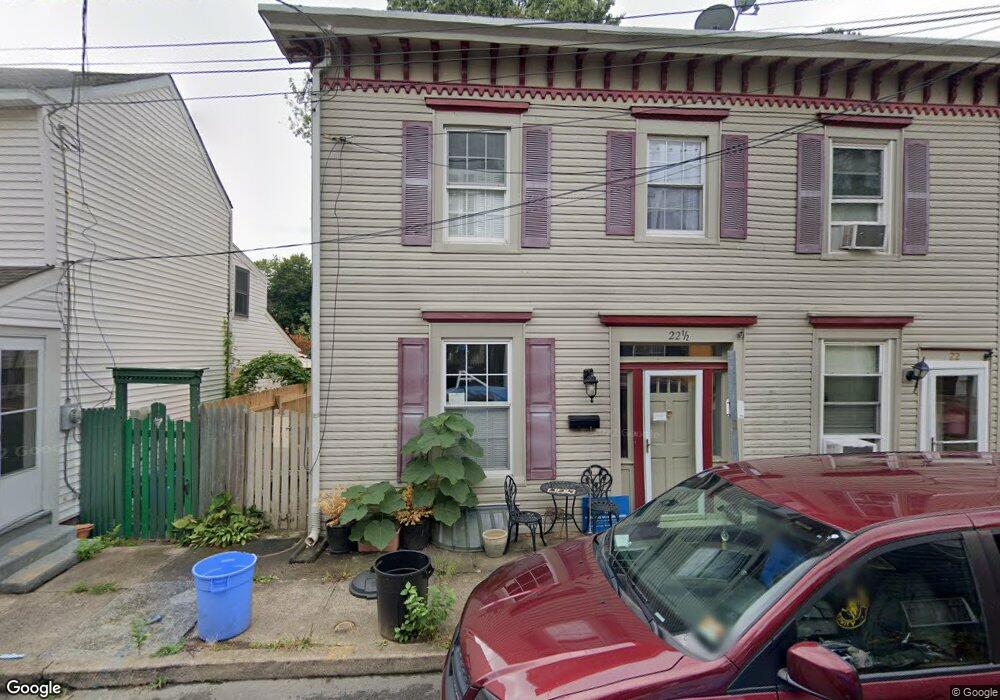
22 1/2 Thompson St Bordentown, NJ 08505
Estimated Value: $275,785 - $342,000
--
Bed
--
Bath
1,312
Sq Ft
$231/Sq Ft
Est. Value
About This Home
This home is located at 22 1/2 Thompson St, Bordentown, NJ 08505 and is currently estimated at $303,446, approximately $231 per square foot. 22 1/2 Thompson St is a home located in Burlington County with nearby schools including Bordentown Reg High School and St Raphael School.
Ownership History
Date
Name
Owned For
Owner Type
Purchase Details
Closed on
Oct 29, 2007
Sold by
Johnson Lorna Ann
Bought by
Quinby Carter F and Szeto Jennifer
Current Estimated Value
Home Financials for this Owner
Home Financials are based on the most recent Mortgage that was taken out on this home.
Original Mortgage
$180,100
Outstanding Balance
$114,245
Interest Rate
6.43%
Mortgage Type
Purchase Money Mortgage
Estimated Equity
$189,201
Purchase Details
Closed on
Jul 8, 2005
Sold by
Seibert James R
Bought by
Johnson Lorna Ann
Home Financials for this Owner
Home Financials are based on the most recent Mortgage that was taken out on this home.
Original Mortgage
$171,000
Interest Rate
5.59%
Mortgage Type
Fannie Mae Freddie Mac
Purchase Details
Closed on
Oct 27, 2004
Sold by
Bollhofer White Joanne
Bought by
Seibert James
Create a Home Valuation Report for This Property
The Home Valuation Report is an in-depth analysis detailing your home's value as well as a comparison with similar homes in the area
Home Values in the Area
Average Home Value in this Area
Purchase History
| Date | Buyer | Sale Price | Title Company |
|---|---|---|---|
| Quinby Carter F | $200,000 | Regional Title Agency | |
| Johnson Lorna Ann | $180,000 | Premier Abstract & Title Age | |
| Seibert James | $120,000 | -- |
Source: Public Records
Mortgage History
| Date | Status | Borrower | Loan Amount |
|---|---|---|---|
| Open | Quinby Carter F | $180,100 | |
| Previous Owner | Johnson Lorna Ann | $171,000 |
Source: Public Records
Tax History Compared to Growth
Tax History
| Year | Tax Paid | Tax Assessment Tax Assessment Total Assessment is a certain percentage of the fair market value that is determined by local assessors to be the total taxable value of land and additions on the property. | Land | Improvement |
|---|---|---|---|---|
| 2025 | $6,009 | $163,200 | $63,200 | $100,000 |
| 2024 | $5,763 | $163,200 | $63,200 | $100,000 |
| 2023 | $5,763 | $163,200 | $63,200 | $100,000 |
| 2022 | $5,563 | $163,200 | $63,200 | $100,000 |
| 2021 | $5,630 | $163,200 | $63,200 | $100,000 |
| 2020 | $5,673 | $163,200 | $63,200 | $100,000 |
| 2019 | $5,738 | $163,200 | $63,200 | $100,000 |
| 2018 | $5,653 | $163,200 | $63,200 | $100,000 |
| 2017 | $5,488 | $163,200 | $63,200 | $100,000 |
| 2016 | $5,436 | $163,200 | $63,200 | $100,000 |
| 2015 | $5,397 | $163,200 | $63,200 | $100,000 |
| 2014 | $5,139 | $163,200 | $63,200 | $100,000 |
Source: Public Records
Map
Nearby Homes
- 22 Thompson St
- 24 Thompson St
- 20 Thompson St
- 26 Thompson St
- 18 Thompson St
- 28 Thompson St
- 30 Thompson St
- 16 Thompson St
- 32 Thompson St
- 14 Thompson St
- 34 Thompson St
- 12 Thompson St
- 21 Thompson St
- 25 Thompson St
- 27 Thompson St Unit BORDE
- 27 Thompson St
- 19 Thompson St
- 29 Thompson St
- 17 Thompson St
- 31 Thompson St