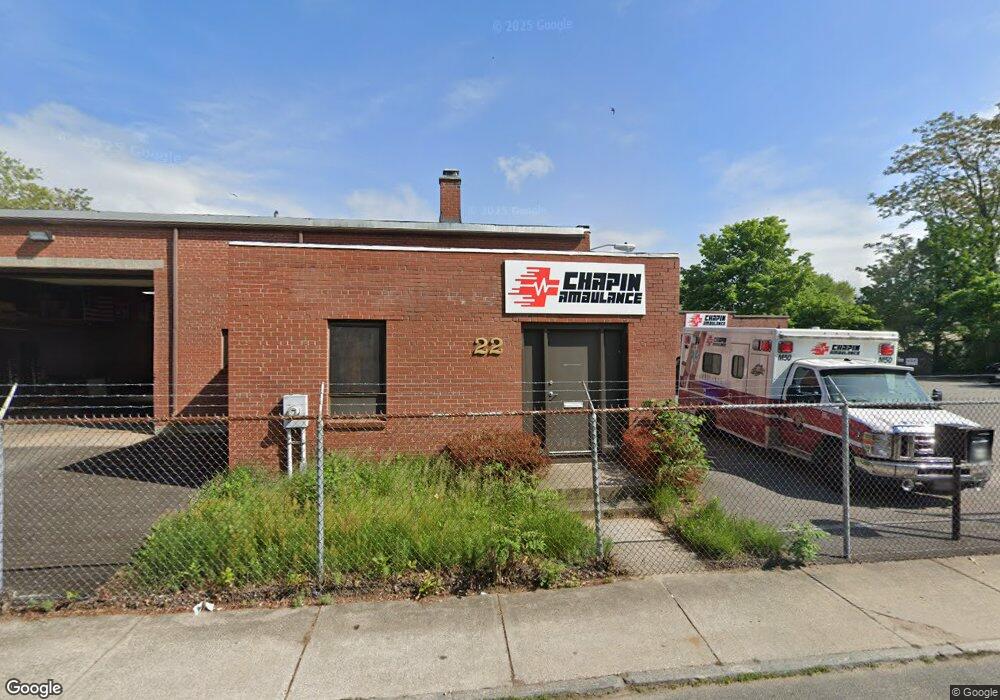
22-24 Tyler St Springfield, MA 01109
Old Hill Neighborhood
--
Bed
2
Baths
5,100
Sq Ft
0.25
Acres
About This Home
This home is located at 22-24 Tyler St, Springfield, MA 01109. 22-24 Tyler St is a home located in Hampden County with nearby schools including William N. DeBerry Elementary School, M Marcus Kiley Middle, and High School Of Commerce.
Ownership History
Date
Name
Owned For
Owner Type
Purchase Details
Closed on
Jul 10, 2019
Sold by
Holubecki Alfred J and Holubecki Henry J
Bought by
Central City Boxing & Brbll
Home Financials for this Owner
Home Financials are based on the most recent Mortgage that was taken out on this home.
Original Mortgage
$100,000
Outstanding Balance
$87,753
Interest Rate
3.9%
Mortgage Type
New Conventional
Purchase Details
Closed on
Jul 2, 1996
Sold by
Kozaczka Patricia
Bought by
Holubecki Henry J and Holubecki Alfred J
Create a Home Valuation Report for This Property
The Home Valuation Report is an in-depth analysis detailing your home's value as well as a comparison with similar homes in the area
Home Values in the Area
Average Home Value in this Area
Purchase History
| Date | Buyer | Sale Price | Title Company |
|---|---|---|---|
| Central City Boxing & Brbll | $245,000 | -- | |
| Holubecki Henry J | $60,000 | -- | |
| Holubecki Henry J | $60,000 | -- |
Source: Public Records
Mortgage History
| Date | Status | Borrower | Loan Amount |
|---|---|---|---|
| Open | Central City Boxing & Brbll | $100,000 |
Source: Public Records
Tax History Compared to Growth
Tax History
| Year | Tax Paid | Tax Assessment Tax Assessment Total Assessment is a certain percentage of the fair market value that is determined by local assessors to be the total taxable value of land and additions on the property. | Land | Improvement |
|---|---|---|---|---|
| 2025 | $12,443 | $353,300 | $43,500 | $309,800 |
| 2024 | $10,453 | $295,200 | $40,800 | $254,400 |
| 2023 | $0 | $269,100 | $39,200 | $229,900 |
| 2022 | $8,619 | $228,500 | $30,100 | $198,400 |
| 2021 | $8,619 | $219,700 | $30,100 | $189,600 |
| 2020 | $8,591 | $219,000 | $30,100 | $188,900 |
| 2019 | $5,070 | $129,000 | $25,600 | $103,400 |
| 2018 | $6,536 | $128,400 | $25,600 | $102,800 |
| 2017 | $6,536 | $167,300 | $24,200 | $143,100 |
| 2016 | $6,238 | $161,600 | $24,200 | $137,400 |
| 2015 | $6,265 | $161,600 | $24,200 | $137,400 |
Source: Public Records
Map
Nearby Homes