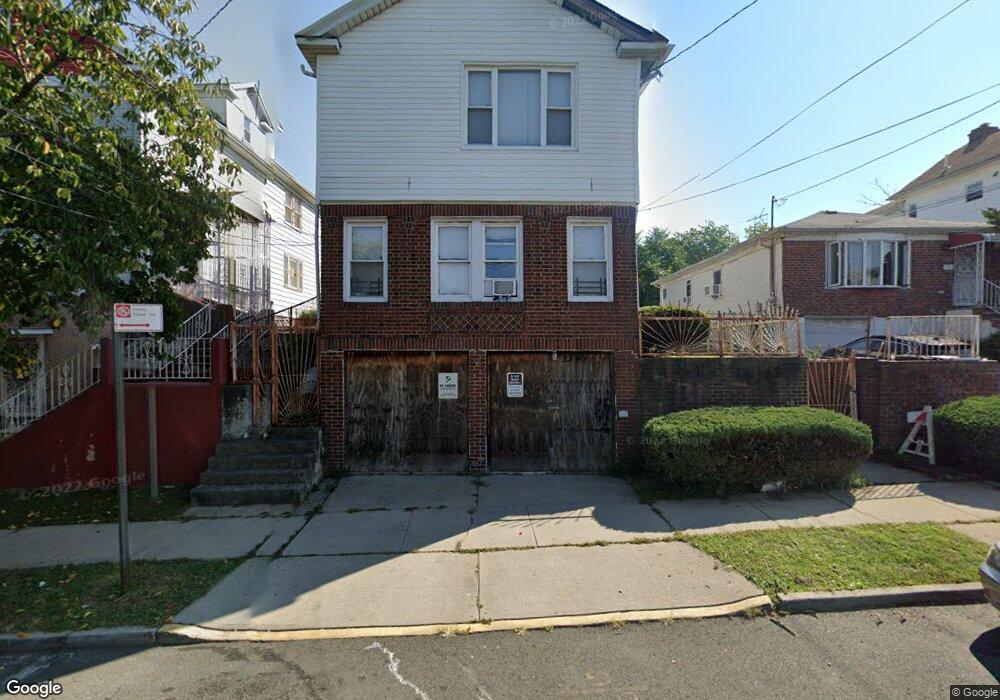
22-49 97th St Unit 1FL Flushing, NY 11369
East Elmhurst NeighborhoodEstimated Value: $863,000 - $1,401,000
3
Beds
2
Baths
2,250
Sq Ft
$502/Sq Ft
Est. Value
About This Home
This home is located at 22-49 97th St Unit 1FL, Flushing, NY 11369 and is currently estimated at $1,130,324, approximately $502 per square foot. 22-49 97th St Unit 1FL is a home located in Queens County with nearby schools including P.S. 127 Aerospace Science Magnet School, I.S. 145 Joseph Pulitzer Magnet School, and William Cullen Bryant High School.
Ownership History
Date
Name
Owned For
Owner Type
Purchase Details
Closed on
Feb 29, 2024
Sold by
Polo Soraya
Bought by
Levy Benjamin A
Current Estimated Value
Home Financials for this Owner
Home Financials are based on the most recent Mortgage that was taken out on this home.
Original Mortgage
$665,000
Outstanding Balance
$654,063
Interest Rate
6.69%
Mortgage Type
Purchase Money Mortgage
Estimated Equity
$476,261
Purchase Details
Closed on
Nov 7, 2000
Sold by
Mitchell Lillian A and Mitchell Leslie A
Bought by
Polo Soraya
Home Financials for this Owner
Home Financials are based on the most recent Mortgage that was taken out on this home.
Original Mortgage
$285,000
Interest Rate
7.78%
Mortgage Type
Purchase Money Mortgage
Purchase Details
Closed on
Mar 4, 1995
Sold by
Mitchell Wesley and Mitchell Lillian
Bought by
Mitchell Wesley and Mitchell Lillian
Create a Home Valuation Report for This Property
The Home Valuation Report is an in-depth analysis detailing your home's value as well as a comparison with similar homes in the area
Home Values in the Area
Average Home Value in this Area
Purchase History
| Date | Buyer | Sale Price | Title Company |
|---|---|---|---|
| Levy Benjamin A | $999,000 | -- | |
| Levy Benjamin A | $999,000 | -- | |
| Polo Soraya | $322,000 | -- | |
| Polo Soraya | $322,000 | -- | |
| Mitchell Wesley | -- | -- | |
| Mitchell Wesley | -- | -- |
Source: Public Records
Mortgage History
| Date | Status | Borrower | Loan Amount |
|---|---|---|---|
| Open | Levy Benjamin A | $665,000 | |
| Closed | Levy Benjamin A | $665,000 | |
| Previous Owner | Polo Soraya | $285,000 |
Source: Public Records
Tax History Compared to Growth
Tax History
| Year | Tax Paid | Tax Assessment Tax Assessment Total Assessment is a certain percentage of the fair market value that is determined by local assessors to be the total taxable value of land and additions on the property. | Land | Improvement |
|---|---|---|---|---|
| 2025 | $6,735 | $35,506 | $6,348 | $29,158 |
| 2024 | $6,735 | $33,534 | $7,186 | $26,348 |
| 2023 | $6,390 | $31,814 | $5,821 | $25,993 |
| 2022 | $6,008 | $61,620 | $12,240 | $49,380 |
| 2021 | $6,228 | $57,960 | $12,240 | $45,720 |
| 2020 | $6,263 | $60,240 | $12,240 | $48,000 |
| 2019 | $5,846 | $57,900 | $12,240 | $45,660 |
| 2018 | $5,404 | $26,512 | $6,056 | $20,456 |
| 2017 | $5,113 | $25,081 | $6,628 | $18,453 |
| 2016 | $4,930 | $25,081 | $6,628 | $18,453 |
| 2015 | $2,854 | $24,657 | $8,100 | $16,557 |
| 2014 | $2,854 | $23,288 | $7,312 | $15,976 |
Source: Public Records
Map
Nearby Homes
- 2240 98th St
- 10002 23rd Ave
- 100-10 23rd Ave
- 10010 23rd Ave
- 23-16 101st St
- 96-19 24th Ave
- 23-66 95th St
- 24-24 Gillmore St
- 24-20 94th St
- 24-14 93rd St
- 97-18 25th Ave
- 25-19 97th St
- 97-09 24th Ave
- 24-49 92nd St
- 10443 Ditmars Blvd
- 2516 Curtis St
- 104-47 Ditmars Blvd
- 2556 100th St
- 2561 99th St
- 31-41 97th St