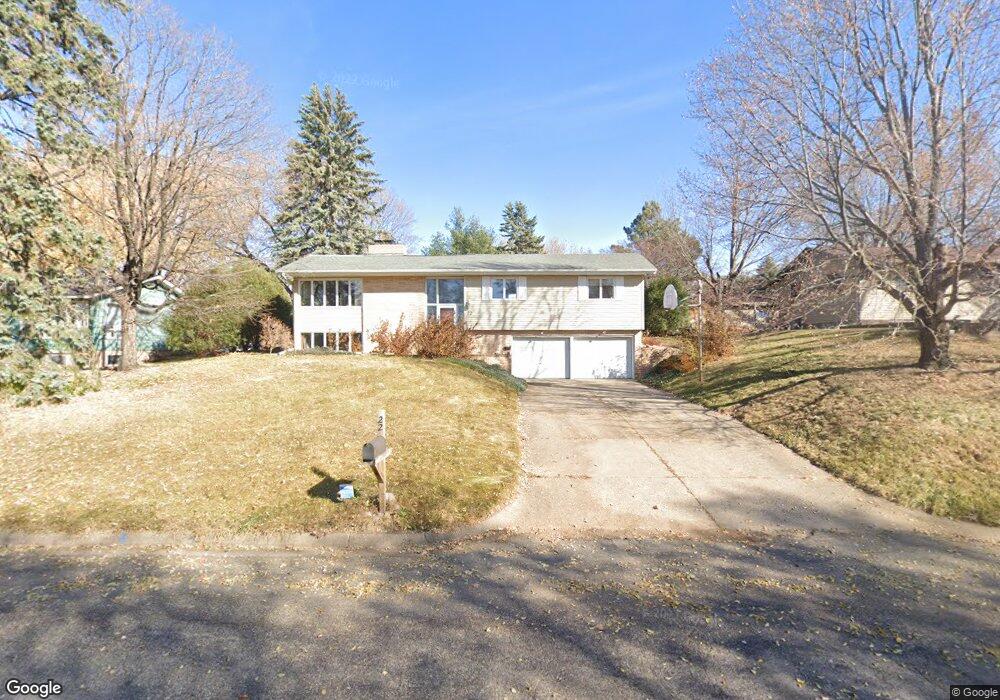
22 4th Ave N Sauk Rapids, MN 56379
Estimated Value: $239,000 - $280,000
3
Beds
2
Baths
1,431
Sq Ft
$184/Sq Ft
Est. Value
About This Home
This home is located at 22 4th Ave N, Sauk Rapids, MN 56379 and is currently estimated at $263,044, approximately $183 per square foot. 22 4th Ave N is a home located in Benton County with nearby schools including Mississippi Heights Elementary School, Sauk Rapids-Rice Middle School, and Sauk Rapids-Rice Senior High School.
Ownership History
Date
Name
Owned For
Owner Type
Purchase Details
Closed on
Jul 27, 2010
Sold by
Frantti Peter D and Frantti Roberta L
Bought by
Johnson Andrew R and Pratt Kristin R
Current Estimated Value
Purchase Details
Closed on
May 21, 2010
Sold by
Frantti Peter D and Frantti Roberta L
Bought by
Johnson Andy and Pratt Kristin
Home Financials for this Owner
Home Financials are based on the most recent Mortgage that was taken out on this home.
Original Mortgage
$137,700
Interest Rate
4.86%
Mortgage Type
New Conventional
Create a Home Valuation Report for This Property
The Home Valuation Report is an in-depth analysis detailing your home's value as well as a comparison with similar homes in the area
Home Values in the Area
Average Home Value in this Area
Purchase History
| Date | Buyer | Sale Price | Title Company |
|---|---|---|---|
| Johnson Andrew R | -- | -- | |
| Johnson Andy | $153,000 | -- |
Source: Public Records
Mortgage History
| Date | Status | Borrower | Loan Amount |
|---|---|---|---|
| Previous Owner | Johnson Andy | $137,700 |
Source: Public Records
Tax History Compared to Growth
Tax History
| Year | Tax Paid | Tax Assessment Tax Assessment Total Assessment is a certain percentage of the fair market value that is determined by local assessors to be the total taxable value of land and additions on the property. | Land | Improvement |
|---|---|---|---|---|
| 2025 | $2,870 | $254,900 | $32,000 | $222,900 |
| 2024 | $2,806 | $243,900 | $32,000 | $211,900 |
| 2023 | $2,698 | $243,300 | $32,000 | $211,300 |
| 2022 | $2,514 | $216,500 | $29,100 | $187,400 |
| 2021 | $2,314 | $187,100 | $29,100 | $158,000 |
| 2018 | $1,880 | $134,800 | $23,919 | $110,881 |
| 2017 | $1,880 | $124,600 | $23,494 | $101,106 |
| 2016 | $1,836 | $135,100 | $28,000 | $107,100 |
| 2015 | $1,854 | $101,300 | $22,316 | $78,984 |
| 2014 | -- | $95,800 | $21,969 | $73,831 |
| 2013 | -- | $97,400 | $22,083 | $75,317 |
Source: Public Records
Map
Nearby Homes
- 117 6th Ave N
- 112 Summit Ave S
- 216 8th Ave N
- 615 3rd Ave N
- 100 9th Ave S
- 608 Summit Ave S
- 224 9th St N
- 2021 Hillcrest Dr
- 3300 321st St
- 3322 321st St
- 1101 10th Ave N
- 1107 10th Ave N
- 1804 8th Ave S
- 1803 8th Ave S
- 2161 Mill Pond Dr
- 1105 Summit Ave N
- 32467 County Road 1
- 314 Pleasant Ridge Dr
- 1209 Millstone Ct
- 752 12th St N