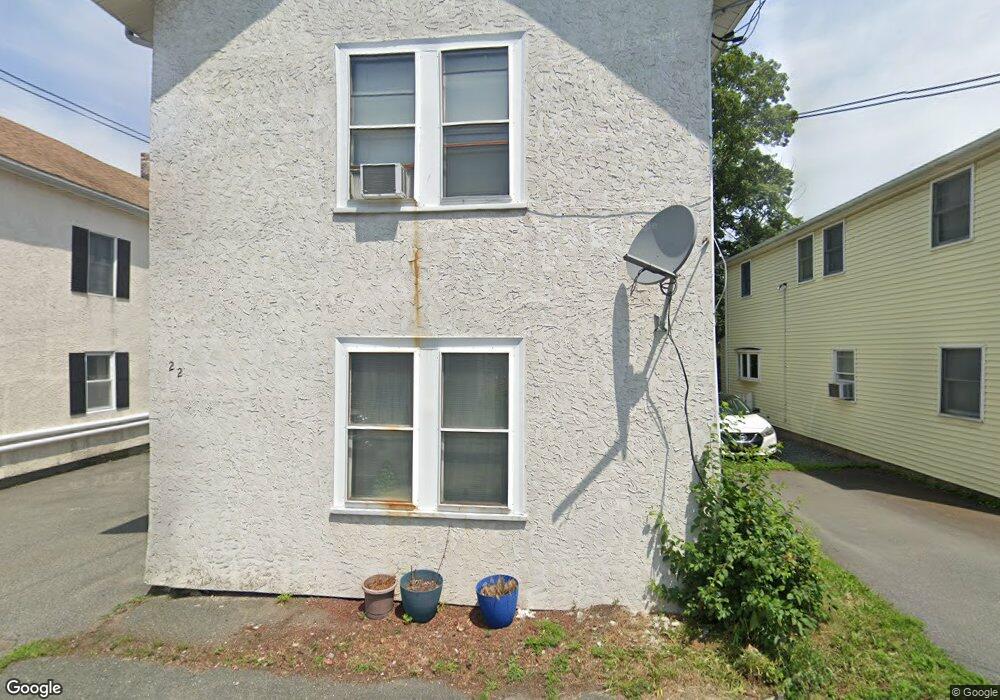
22 Aborn St Salem, MA 01970
Gallows Hill NeighborhoodEstimated Value: $580,000 - $709,000
4
Beds
3
Baths
2,309
Sq Ft
$287/Sq Ft
Est. Value
About This Home
This home is located at 22 Aborn St, Salem, MA 01970 and is currently estimated at $663,043, approximately $287 per square foot. 22 Aborn St is a home located in Essex County with nearby schools including Witchcraft Heights Elementary School, Horace Mann Laboratory, and Bates Elementary School.
Ownership History
Date
Name
Owned For
Owner Type
Purchase Details
Closed on
Mar 6, 2008
Sold by
Silva Belmiro S and Sousa Ladislau M
Bought by
Silva Tr Belmiro S
Current Estimated Value
Purchase Details
Closed on
Nov 23, 1993
Sold by
22 Aborn St Salem R T
Bought by
Silva Beliro S and Sousa Ladislau M
Home Financials for this Owner
Home Financials are based on the most recent Mortgage that was taken out on this home.
Original Mortgage
$91,800
Interest Rate
6.77%
Mortgage Type
Purchase Money Mortgage
Create a Home Valuation Report for This Property
The Home Valuation Report is an in-depth analysis detailing your home's value as well as a comparison with similar homes in the area
Home Values in the Area
Average Home Value in this Area
Purchase History
| Date | Buyer | Sale Price | Title Company |
|---|---|---|---|
| Silva Tr Belmiro S | -- | -- | |
| Silva Beliro S | $102,000 | -- |
Source: Public Records
Mortgage History
| Date | Status | Borrower | Loan Amount |
|---|---|---|---|
| Previous Owner | Silva Beliro S | $69,000 | |
| Previous Owner | Silva Beliro S | $91,800 |
Source: Public Records
Tax History Compared to Growth
Tax History
| Year | Tax Paid | Tax Assessment Tax Assessment Total Assessment is a certain percentage of the fair market value that is determined by local assessors to be the total taxable value of land and additions on the property. | Land | Improvement |
|---|---|---|---|---|
| 2025 | $6,409 | $565,200 | $159,800 | $405,400 |
| 2024 | $6,134 | $527,900 | $151,400 | $376,500 |
| 2023 | $5,933 | $474,300 | $140,200 | $334,100 |
| 2022 | $6,053 | $456,800 | $131,800 | $325,000 |
| 2021 | $5,865 | $425,000 | $131,800 | $293,200 |
| 2020 | $5,607 | $388,000 | $113,800 | $274,200 |
| 2019 | $5,557 | $368,000 | $108,200 | $259,800 |
| 2018 | $5,138 | $334,100 | $103,200 | $230,900 |
| 2017 | $4,766 | $300,500 | $84,100 | $216,400 |
| 2016 | $4,638 | $296,000 | $79,600 | $216,400 |
| 2015 | $4,486 | $273,400 | $71,800 | $201,600 |
Source: Public Records
Map
Nearby Homes