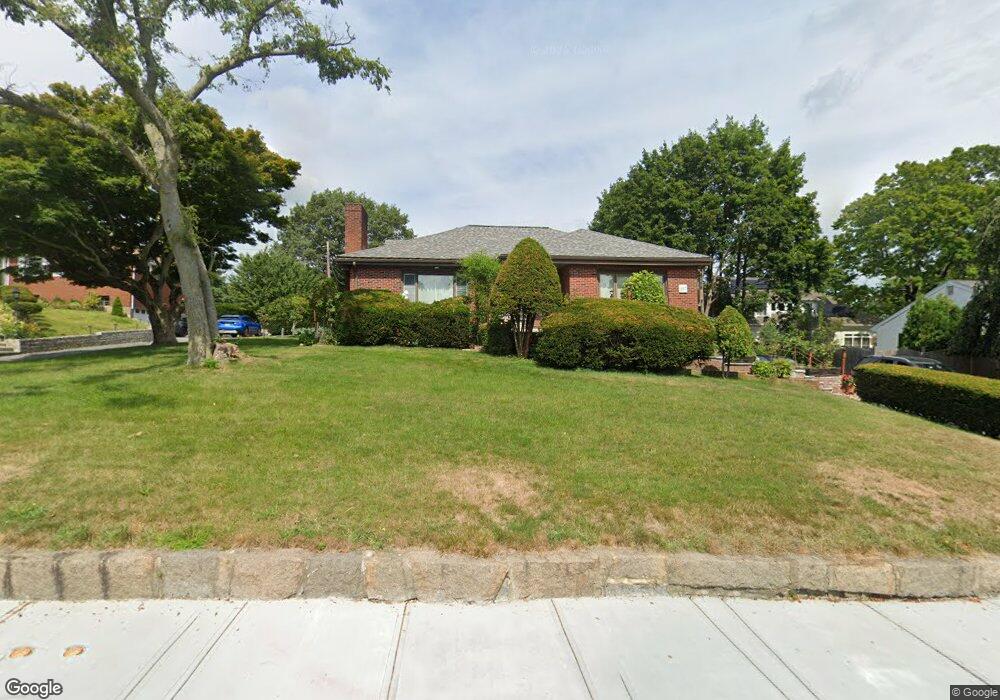
22 Adams Cir Quincy, MA 02169
Quincy Center NeighborhoodEstimated Value: $772,022 - $927,000
2
Beds
2
Baths
1,654
Sq Ft
$529/Sq Ft
Est. Value
About This Home
This home is located at 22 Adams Cir, Quincy, MA 02169 and is currently estimated at $874,256, approximately $528 per square foot. 22 Adams Cir is a home located in Norfolk County with nearby schools including Charles A. Bernazzani Elementary School, Central Middle School, and North Quincy High School.
Ownership History
Date
Name
Owned For
Owner Type
Purchase Details
Closed on
Jun 30, 2008
Sold by
Parker Mildred
Bought by
Leong Frank and Leong Maria
Current Estimated Value
Home Financials for this Owner
Home Financials are based on the most recent Mortgage that was taken out on this home.
Original Mortgage
$328,500
Interest Rate
6.07%
Mortgage Type
Purchase Money Mortgage
Create a Home Valuation Report for This Property
The Home Valuation Report is an in-depth analysis detailing your home's value as well as a comparison with similar homes in the area
Home Values in the Area
Average Home Value in this Area
Purchase History
| Date | Buyer | Sale Price | Title Company |
|---|---|---|---|
| Leong Frank | $438,000 | -- | |
| Leong Frank | $438,000 | -- |
Source: Public Records
Mortgage History
| Date | Status | Borrower | Loan Amount |
|---|---|---|---|
| Open | Leong Frank | $260,000 | |
| Closed | Leong Frank | $328,500 |
Source: Public Records
Tax History
| Year | Tax Paid | Tax Assessment Tax Assessment Total Assessment is a certain percentage of the fair market value that is determined by local assessors to be the total taxable value of land and additions on the property. | Land | Improvement |
|---|---|---|---|---|
| 2025 | $7,769 | $673,800 | $310,000 | $363,800 |
| 2024 | $7,390 | $655,700 | $295,400 | $360,300 |
| 2023 | $6,923 | $622,000 | $268,800 | $353,200 |
| 2022 | $7,238 | $604,200 | $244,600 | $359,600 |
| 2021 | $6,905 | $568,800 | $244,600 | $324,200 |
| 2020 | $7,049 | $567,100 | $233,000 | $334,100 |
| 2019 | $6,909 | $550,500 | $220,000 | $330,500 |
| 2018 | $6,926 | $519,200 | $220,000 | $299,200 |
| 2017 | $6,663 | $470,200 | $209,700 | $260,500 |
| 2016 | $6,314 | $439,700 | $199,800 | $239,900 |
| 2015 | $6,110 | $418,500 | $199,800 | $218,700 |
| 2014 | $5,919 | $398,300 | $190,400 | $207,900 |
Source: Public Records
Map
Nearby Homes
- 312 Adams St
- 14 Presidents Ln Unit 10
- 999 Hancock St Unit 502
- 45 Oval Rd Unit 34
- 165 Whitwell St
- 43 Dixwell Ave
- 18 Johnson Ave Unit 3
- 20 Whitney Rd Unit 1
- 38 Jenness St
- 74 Butler Rd
- 195 Thomas Burgin Pkwy Unit 301
- 10 Edgemere Rd
- 157 Beale St Unit 6
- 198 Taylor St
- 452 Quarry St
- 33 Bishop Rd Unit 33
- 270 Southern Artery
- 169 Pine St
- 211 Copeland St
- 283 Copeland St
Your Personal Tour Guide
Ask me questions while you tour the home.