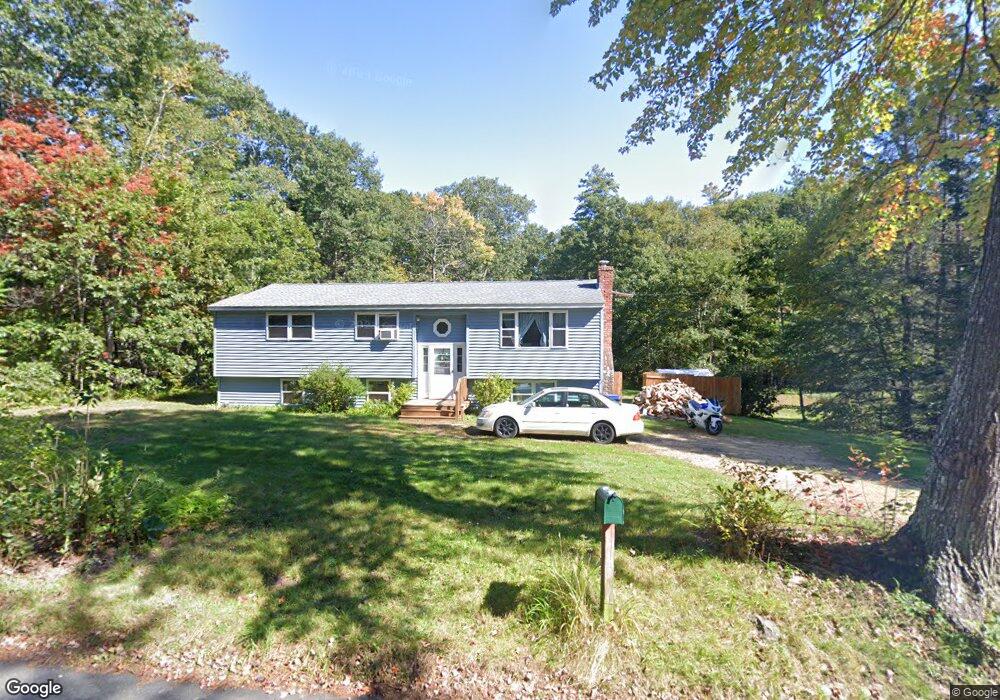
22 Adams Rd Hubbardston, MA 01452
Estimated Value: $372,000 - $410,000
3
Beds
2
Baths
1,145
Sq Ft
$341/Sq Ft
Est. Value
About This Home
This home is located at 22 Adams Rd, Hubbardston, MA 01452 and is currently estimated at $390,011, approximately $340 per square foot. 22 Adams Rd is a home located in Worcester County with nearby schools including Quabbin Regional Middle School and Quabbin Regional High School.
Ownership History
Date
Name
Owned For
Owner Type
Purchase Details
Closed on
Jul 23, 2010
Sold by
Loiselle Eric J
Bought by
Loiselle Jane B
Current Estimated Value
Purchase Details
Closed on
Jul 2, 1997
Sold by
Chicoine Michael A
Bought by
Loiselle Eric J and Loiselle Jane B
Home Financials for this Owner
Home Financials are based on the most recent Mortgage that was taken out on this home.
Original Mortgage
$83,200
Interest Rate
7.86%
Mortgage Type
Purchase Money Mortgage
Purchase Details
Closed on
Mar 29, 1989
Sold by
Chicoine Michael A
Bought by
Chicoine Michael A
Home Financials for this Owner
Home Financials are based on the most recent Mortgage that was taken out on this home.
Original Mortgage
$37,500
Interest Rate
10.63%
Mortgage Type
Purchase Money Mortgage
Create a Home Valuation Report for This Property
The Home Valuation Report is an in-depth analysis detailing your home's value as well as a comparison with similar homes in the area
Home Values in the Area
Average Home Value in this Area
Purchase History
| Date | Buyer | Sale Price | Title Company |
|---|---|---|---|
| Loiselle Jane B | -- | -- | |
| Loiselle Eric J | $92,500 | -- | |
| Chicoine Michael A | $37,500 | -- |
Source: Public Records
Mortgage History
| Date | Status | Borrower | Loan Amount |
|---|---|---|---|
| Previous Owner | Chicoine Michael A | $83,200 | |
| Previous Owner | Chicoine Michael A | $20,000 | |
| Previous Owner | Chicoine Michael A | $37,500 |
Source: Public Records
Tax History Compared to Growth
Tax History
| Year | Tax Paid | Tax Assessment Tax Assessment Total Assessment is a certain percentage of the fair market value that is determined by local assessors to be the total taxable value of land and additions on the property. | Land | Improvement |
|---|---|---|---|---|
| 2025 | $3,451 | $295,500 | $42,300 | $253,200 |
| 2024 | $3,101 | $263,000 | $40,400 | $222,600 |
| 2023 | $2,614 | $200,600 | $35,500 | $165,100 |
| 2022 | $2,808 | $200,600 | $35,500 | $165,100 |
| 2021 | $2,700 | $182,300 | $35,500 | $146,800 |
| 2020 | $2,682 | $181,000 | $35,500 | $145,500 |
| 2019 | $2,641 | $173,500 | $48,300 | $125,200 |
| 2018 | $2,380 | $157,300 | $48,300 | $109,000 |
| 2017 | $2,396 | $157,300 | $48,300 | $109,000 |
| 2016 | $2,310 | $145,300 | $48,300 | $97,000 |
| 2015 | $2,257 | $151,300 | $48,300 | $103,000 |
| 2014 | $2,197 | $151,300 | $48,300 | $103,000 |
Source: Public Records
Map
Nearby Homes
- 0 Chippewa St
- 40 Lombard Rd
- 23 Iroquois Ave
- 37 Grimes Rd
- Lot 0 Old Westminster Rd
- 14 Lighthouse Ln
- 207 W Princeton Rd
- 45 Old Colony Rd
- 47 Brigham St
- 62 Bolton Rd Unit Applewood
- 62 Bolton Rd Unit Oakmont
- 106 Gardner Rd
- 5 Kurikka Place
- 65 Davis Rd
- 21 Davis Rd
- Lot A Frog Hollow Rd
- 4 Pitcherville Rd
- 240-Lot 2 Davis Rd
- 620 Whitney St
- 23 Geordie Ln