J
Seller's Agent in 2025
Jackie Painchaud
The Neighborhood Realty Group
(774) 253-9354
4 in this area
101 Total Sales
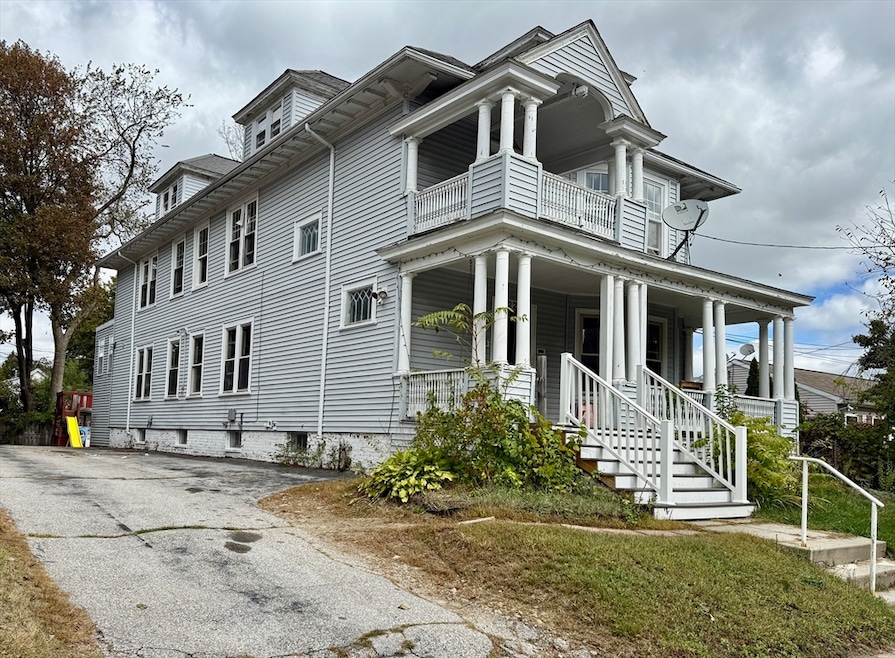
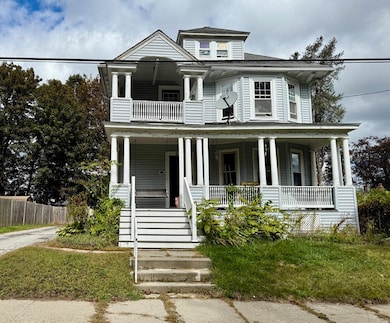
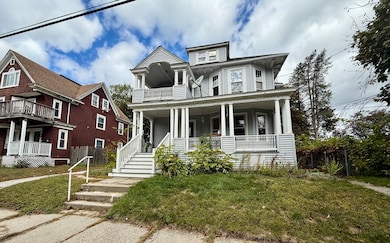
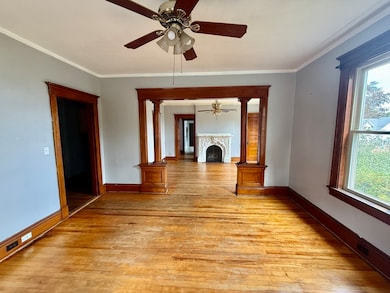
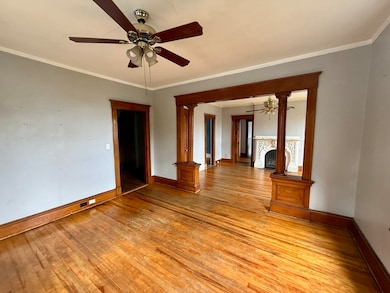
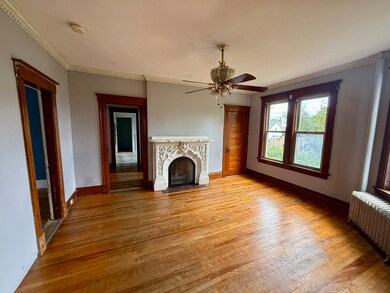
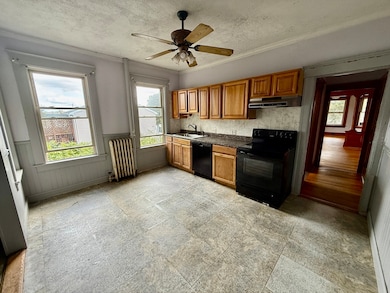
Stop what you're doing & check out this MASSIVE 2-family tucked away on a quiet street just outside of Webster Sq. The space & potential here are endless. The 1st floor features a giant 3 bedroom 2 bath apartment with a primary suite, an attached sunroom / office w/ private entrance & large deck. You'll appreciate the hardwood floors & natural woodwork throughout. The 2nd floor apartment also features hardwood floors & large rooms throughout & can be combined with the finished attic to make a 4-5 bedroom 2 bath unit. The views from this apartment are absolutely beautiful. 1st & 2nd floors are heated with oil. 3rd floor is heated by electric. There is plenty of off-street parking and a good size back yard. Excellent opportunity for an owner occupant willing to put in a little work or a perfect opportunity for an investor. The location & size of the units will command top rents. Buildings this size don't come available often. Make an offer today!
Last Agent to Sell the Property
The Neighborhood Realty Group Listed on: 09/26/2025

| Date | Type | Sale Price | Title Company |
|---|---|---|---|
| Quit Claim Deed | $540,000 | -- | |
| Quit Claim Deed | $185,000 | -- | |
| Quit Claim Deed | $185,000 | -- | |
| Deed | $101,707 | -- | |
| Deed | $150,000 | -- |
| Date | Status | Loan Amount | Loan Type |
|---|---|---|---|
| Open | $405,000 | New Conventional | |
| Previous Owner | $181,649 | FHA | |
| Previous Owner | $178,500 | No Value Available | |
| Previous Owner | $10,000 | No Value Available |
| Date | Event | Price | List to Sale | Price per Sq Ft |
|---|---|---|---|---|
| 12/04/2025 12/04/25 | Sold | $540,000 | -4.4% | $168 / Sq Ft |
| 11/04/2025 11/04/25 | Pending | -- | -- | -- |
| 11/04/2025 11/04/25 | Price Changed | $565,000 | 0.0% | $176 / Sq Ft |
| 11/04/2025 11/04/25 | For Sale | $565,000 | -2.6% | $176 / Sq Ft |
| 10/21/2025 10/21/25 | Pending | -- | -- | -- |
| 10/14/2025 10/14/25 | Price Changed | $580,000 | -2.5% | $181 / Sq Ft |
| 09/26/2025 09/26/25 | For Sale | $595,000 | -- | $185 / Sq Ft |
| Year | Tax Paid | Tax Assessment Tax Assessment Total Assessment is a certain percentage of the fair market value that is determined by local assessors to be the total taxable value of land and additions on the property. | Land | Improvement |
|---|---|---|---|---|
| 2025 | $7,206 | $546,300 | $98,400 | $447,900 |
| 2024 | $6,837 | $497,200 | $98,400 | $398,800 |
| 2023 | $6,401 | $446,400 | $85,600 | $360,800 |
| 2022 | $5,920 | $389,200 | $68,500 | $320,700 |
| 2021 | $5,498 | $337,700 | $54,800 | $282,900 |
| 2020 | $5,136 | $302,100 | $54,400 | $247,700 |
| 2019 | $5,144 | $285,800 | $47,500 | $238,300 |
| 2018 | $5,021 | $265,500 | $47,500 | $218,000 |
| 2017 | $4,772 | $248,300 | $47,500 | $200,800 |
| 2016 | $4,769 | $231,400 | $33,900 | $197,500 |
| 2015 | $4,644 | $231,400 | $33,900 | $197,500 |
| 2014 | $4,522 | $231,400 | $33,900 | $197,500 |
J
Seller's Agent in 2025
Jackie Painchaud
The Neighborhood Realty Group
(774) 253-9354
4 in this area
101 Total Sales
Buyer's Agent in 2025
KAREN MILHEM
Media Realty Group Inc.
(774) 321-4541
1 in this area
79 Total Sales
Source: MLS Property Information Network (MLS PIN)
MLS Number: 73436333
APN: WORC-000008-000041-000011
Disclaimer: Certain information contained herein is derived from information provided by parties other than Homes.com. All information provided is deemed reliable, but is not guaranteed to be accurate and should be independently verified.
![]() The property listing data and information, or the Images, set forth herein were provided to MLS Property Information Network, Inc. from third party sources, including sellers, lessors and public records, and were compiled by MLS Property Information Network, Inc. The property listing data and information, and the Images, are for the personal, non-commercial use of consumers having a good faith interest in purchasing or leasing listed properties of the type displayed to them and may not be used for any purpose other than to identify prospective properties which such consumers may have a good faith interest in purchasing or leasing. MLS Property Information Network, Inc. and its subscribers disclaim any and all representations and warranties as to the accuracy of the property listing data and information, or as to the accuracy of any of the Images, set forth herein.
The property listing data and information, or the Images, set forth herein were provided to MLS Property Information Network, Inc. from third party sources, including sellers, lessors and public records, and were compiled by MLS Property Information Network, Inc. The property listing data and information, and the Images, are for the personal, non-commercial use of consumers having a good faith interest in purchasing or leasing listed properties of the type displayed to them and may not be used for any purpose other than to identify prospective properties which such consumers may have a good faith interest in purchasing or leasing. MLS Property Information Network, Inc. and its subscribers disclaim any and all representations and warranties as to the accuracy of the property listing data and information, or as to the accuracy of any of the Images, set forth herein.