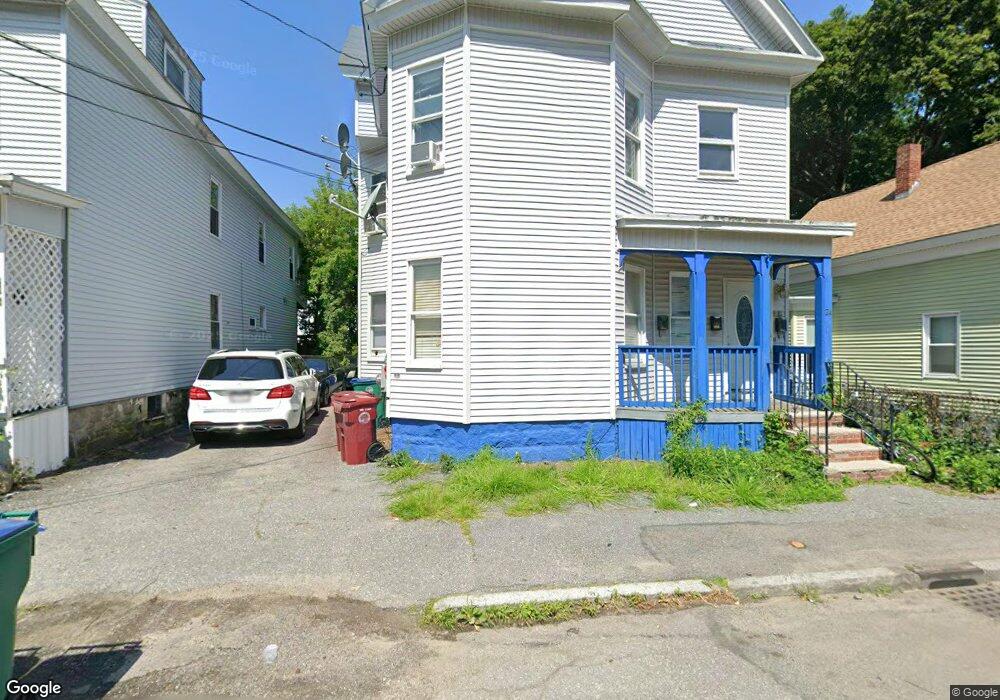
22 Barclay St Lowell, MA 01851
Lower Highlands NeighborhoodEstimated Value: $683,000 - $719,954
7
Beds
3
Baths
5,024
Sq Ft
$140/Sq Ft
Est. Value
About This Home
This home is located at 22 Barclay St, Lowell, MA 01851 and is currently estimated at $701,739, approximately $139 per square foot. 22 Barclay St is a home located in Middlesex County with nearby schools including Abraham Lincoln Elementary School, Charles W. Morey Elementary School, and Charlotte M. Murkland Elementary School.
Ownership History
Date
Name
Owned For
Owner Type
Purchase Details
Closed on
Feb 4, 2025
Sold by
Opoku-Mensah Kwame and Nimo Thomas
Bought by
Opoku-Mensah Kwame
Current Estimated Value
Purchase Details
Closed on
Apr 5, 2011
Sold by
Mensah Opoku Kwame
Bought by
Lowell City Of
Purchase Details
Closed on
Oct 11, 2005
Sold by
Garthe Gary K and Garthe Lynne M
Bought by
Opoku-Mensah Kwame and Nimo Thomas
Home Financials for this Owner
Home Financials are based on the most recent Mortgage that was taken out on this home.
Original Mortgage
$296,000
Interest Rate
5.81%
Mortgage Type
Purchase Money Mortgage
Create a Home Valuation Report for This Property
The Home Valuation Report is an in-depth analysis detailing your home's value as well as a comparison with similar homes in the area
Home Values in the Area
Average Home Value in this Area
Purchase History
| Date | Buyer | Sale Price | Title Company |
|---|---|---|---|
| Opoku-Mensah Kwame | -- | None Available | |
| Opoku-Mensah Kwame | -- | None Available | |
| Lowell City Of | $1,368 | -- | |
| Lowell City Of | $1,368 | -- | |
| Opoku-Mensah Kwame | $370,000 | -- | |
| Opoku-Mensah Kwame | $370,000 | -- | |
| Opoku-Mensah Kwame | $370,000 | -- |
Source: Public Records
Mortgage History
| Date | Status | Borrower | Loan Amount |
|---|---|---|---|
| Previous Owner | Opoku-Mensah Kwame | $296,000 |
Source: Public Records
Tax History Compared to Growth
Tax History
| Year | Tax Paid | Tax Assessment Tax Assessment Total Assessment is a certain percentage of the fair market value that is determined by local assessors to be the total taxable value of land and additions on the property. | Land | Improvement |
|---|---|---|---|---|
| 2025 | $7,257 | $632,100 | $101,200 | $530,900 |
| 2024 | $6,915 | $580,600 | $94,600 | $486,000 |
| 2023 | $6,794 | $547,000 | $82,300 | $464,700 |
| 2022 | $6,184 | $487,300 | $65,000 | $422,300 |
| 2021 | $5,330 | $396,000 | $56,500 | $339,500 |
| 2020 | $4,880 | $365,300 | $56,500 | $308,800 |
| 2019 | $4,760 | $339,000 | $53,800 | $285,200 |
| 2018 | $4,331 | $301,000 | $51,200 | $249,800 |
| 2017 | $4,151 | $278,200 | $49,600 | $228,600 |
| 2016 | $3,976 | $262,300 | $46,100 | $216,200 |
| 2015 | $3,751 | $242,300 | $46,100 | $196,200 |
| 2013 | $3,239 | $215,800 | $55,300 | $160,500 |
Source: Public Records
Map
Nearby Homes
- 18 Barclay St
- 28 Barclay St
- 160 Smith St
- 32 Barclay St
- 10 Brickett Ave
- 16 Barclay St
- 4 Cheney Place
- 8 Brickett Ave
- 34 Barclay St
- 34 Barclay St Unit 1
- 36 Barclay St Unit 2
- 36 Barclay St Unit 3
- 11 Brickett Ave
- 12 Barclay St
- 15 Barclay St
- 8 Cheney Place
- 25 Barclay St
- 164 Smith St
- 9 Brickett Ave
- 158 Smith St