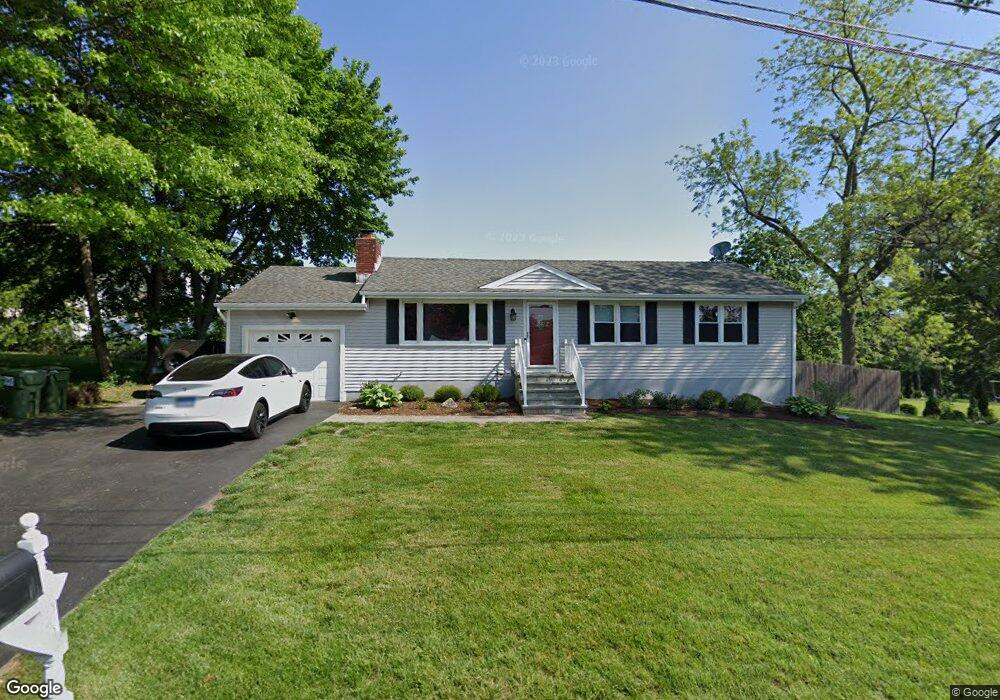
22 Beech St Trumbull, CT 06611
West Trumbull NeighborhoodEstimated Value: $554,000 - $605,000
3
Beds
2
Baths
1,628
Sq Ft
$360/Sq Ft
Est. Value
About This Home
This home is located at 22 Beech St, Trumbull, CT 06611 and is currently estimated at $585,833, approximately $359 per square foot. 22 Beech St is a home located in Fairfield County with nearby schools including Frenchtown Elementary School, Madison Middle School, and Trumbull High School.
Ownership History
Date
Name
Owned For
Owner Type
Purchase Details
Closed on
Mar 5, 2022
Sold by
Duenges William A and Lombardi Jacqueline D
Bought by
T W
Current Estimated Value
Purchase Details
Closed on
Sep 27, 1996
Sold by
Giardini Thomas J and Giardini Richard
Bought by
Duenges William A and Duenges Jacqueline
Create a Home Valuation Report for This Property
The Home Valuation Report is an in-depth analysis detailing your home's value as well as a comparison with similar homes in the area
Home Values in the Area
Average Home Value in this Area
Purchase History
| Date | Buyer | Sale Price | Title Company |
|---|---|---|---|
| T W | -- | None Available | |
| Duenges William A | $175,000 | -- |
Source: Public Records
Mortgage History
| Date | Status | Borrower | Loan Amount |
|---|---|---|---|
| Previous Owner | Duenges William A | $276,595 | |
| Previous Owner | Duenges William A | $300,000 | |
| Previous Owner | Duenges William A | $25,000 |
Source: Public Records
Tax History
| Year | Tax Paid | Tax Assessment Tax Assessment Total Assessment is a certain percentage of the fair market value that is determined by local assessors to be the total taxable value of land and additions on the property. | Land | Improvement |
|---|---|---|---|---|
| 2025 | $9,378 | $255,220 | $139,230 | $115,990 |
| 2024 | $9,113 | $255,220 | $139,230 | $115,990 |
| 2023 | $8,968 | $255,220 | $139,230 | $115,990 |
| 2022 | $8,823 | $255,220 | $139,230 | $115,990 |
| 2021 | $7,748 | $213,080 | $113,960 | $99,120 |
| 2020 | $7,599 | $213,080 | $113,960 | $99,120 |
| 2018 | $7,429 | $213,080 | $113,960 | $99,120 |
| 2017 | $7,292 | $213,080 | $113,960 | $99,120 |
| 2016 | $7,104 | $213,080 | $113,960 | $99,120 |
| 2015 | $7,142 | $213,400 | $114,000 | $99,400 |
| 2014 | $6,991 | $213,400 | $114,000 | $99,400 |
Source: Public Records
Map
Nearby Homes
- lot 194 Prospect Ave
- 18 Ridgebury Dr
- 66 Loftus Cir
- 81 Lance Cir
- 3460 Old Town Rd
- 8 Raleigh Rd
- 121 Campbell Rd
- 5763 Park Ave
- 26 Grove St
- 40 Toll House Ln
- 132 Toll House Ln
- 110 Minturn Rd
- 114 Minturn Place
- 252 Bear Paw Rd
- 10 Aragon Dr
- 394 Anton Dr
- 3370 Madison Ave Unit 10B
- 45 Frenchtown Rd
- 93 Tersana Dr
- 108 Ferndale Dr