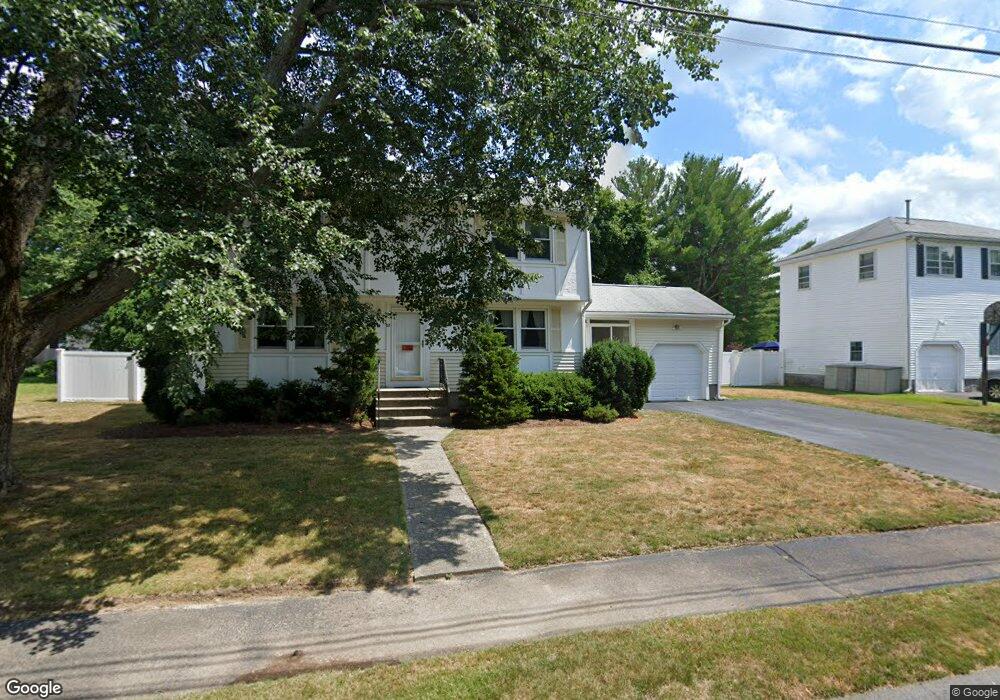
22 Brewster Dr Needham, MA 02492
Needham AreaEstimated Value: $1,186,000 - $1,486,890
About This Home
This home is located at 22 Brewster Dr, Needham, MA 02492 and is currently estimated at $1,291,973, approximately $1,583 per square foot. 22 Brewster Dr is a home located in Norfolk County with nearby schools including Newman Elementary School, High Rock Middle School, and Pollard Middle School.
Ownership History
We collect this data history from publicly available records. To have your information removed, we recommend requesting removal directly through your county’s website.
Purchase Details
Home Financials for this Owner
Home Financials are based on the most recent Mortgage that was taken out on this home.Purchase Details
Home Values in the Area
Average Home Value in this Area
Purchase History
We collect this data history from publicly available records. To have your information removed, we recommend requesting removal directly through your county’s website.
| Date | Buyer | Sale Price | Title Company |
|---|---|---|---|
| $750,000 | -- | ||
| -- | -- |
Mortgage History
We collect this data history from publicly available records. To have your information removed, we recommend requesting removal directly through your county’s website.
| Date | Status | Borrower | Loan Amount |
|---|---|---|---|
| Open | $612,000 | ||
| Closed | $600,000 |
Tax History
We collect this data history from publicly available records. To have your information removed, we recommend requesting removal directly through your county’s website.
| Year | Tax Paid | Tax Assessment Tax Assessment Total Assessment is a certain percentage of the fair market value that is determined by local assessors to be the total taxable value of land and additions on the property. | Land | Improvement |
|---|---|---|---|---|
| 2025 | $11,572 | $1,091,700 | $800,500 | $291,200 |
| 2024 | $10,799 | $862,500 | $577,500 | $285,000 |
| 2023 | $10,972 | $841,400 | $577,500 | $263,900 |
| 2022 | $10,292 | $769,800 | $516,000 | $253,800 |
| 2021 | $10,030 | $769,800 | $516,000 | $253,800 |
| 2020 | $9,532 | $763,200 | $516,000 | $247,200 |
| 2019 | $8,846 | $714,000 | $469,400 | $244,600 |
| 2018 | $8,482 | $714,000 | $469,400 | $244,600 |
| 2017 | $8,135 | $684,200 | $469,400 | $214,800 |
| 2016 | $7,923 | $686,600 | $469,400 | $217,200 |
| 2015 | $7,752 | $686,600 | $469,400 | $217,200 |
| 2014 | $7,235 | $621,600 | $408,600 | $213,000 |
Map
- 26 Carol Rd
- 29 Canavan Cir
- 17 Whiting Way
- 57 Mayflower Rd
- 16 Stockdale Rd
- 1480 Great Plain Ave
- 17 Sunrise Terrace
- 1069 Central Ave
- 180 Meetinghouse Cir
- 620 High Rock St
- 1275 Central Ave
- 1360 Great Plain Ave
- 1362 Great Plain Ave Unit 1
- 52 Hancock Rd
- 89 Rolling Ln
- 122 Great Plain Ave
- 1333 Great Plain Ave
- 11 Skyline Dr
- 47 Rolling Ln
- 298 Marked Tree Rd
Ask me questions while you tour the home.