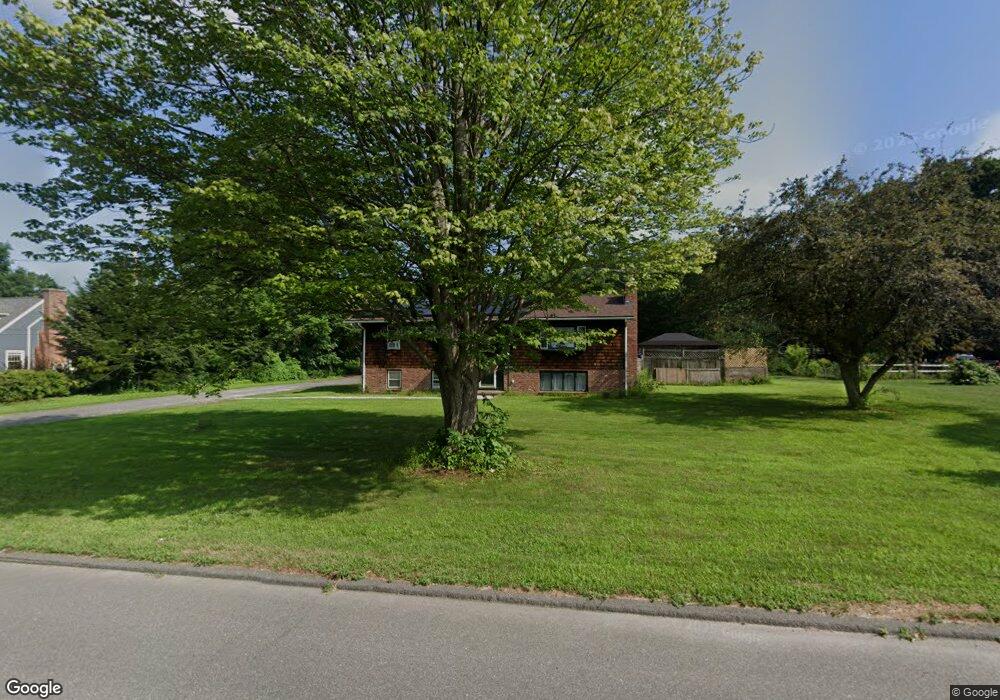
22 Bridge St Hatfield, MA 01038
Estimated Value: $329,000 - $472,176
4
Beds
2
Baths
1,344
Sq Ft
$281/Sq Ft
Est. Value
About This Home
This home is located at 22 Bridge St, Hatfield, MA 01038 and is currently estimated at $377,794, approximately $281 per square foot. 22 Bridge St is a home located in Hampshire County with nearby schools including Browerville Elementary School and Brooklyn Center Middle School.
Ownership History
Date
Name
Owned For
Owner Type
Purchase Details
Closed on
Dec 15, 2022
Sold by
C & K Ii Llp
Bought by
Dsi Llp
Current Estimated Value
Purchase Details
Closed on
Jan 11, 2005
Sold by
Diggins Marion K
Bought by
Diggins Susan M
Home Financials for this Owner
Home Financials are based on the most recent Mortgage that was taken out on this home.
Original Mortgage
$129,000
Interest Rate
5.75%
Mortgage Type
Purchase Money Mortgage
Create a Home Valuation Report for This Property
The Home Valuation Report is an in-depth analysis detailing your home's value as well as a comparison with similar homes in the area
Home Values in the Area
Average Home Value in this Area
Purchase History
| Date | Buyer | Sale Price | Title Company |
|---|---|---|---|
| Dsi Llp | -- | None Available | |
| Diggins Susan M | $162,000 | -- |
Source: Public Records
Mortgage History
| Date | Status | Borrower | Loan Amount |
|---|---|---|---|
| Previous Owner | Diggins Susan M | $129,000 | |
| Previous Owner | Diggins Susan M | $10,000 | |
| Previous Owner | Diggins Susan M | $110,000 | |
| Previous Owner | Diggins Susan M | $40,000 |
Source: Public Records
Tax History Compared to Growth
Tax History
| Year | Tax Paid | Tax Assessment Tax Assessment Total Assessment is a certain percentage of the fair market value that is determined by local assessors to be the total taxable value of land and additions on the property. | Land | Improvement |
|---|---|---|---|---|
| 2025 | $5,112 | $369,400 | $154,200 | $215,200 |
| 2024 | $4,985 | $325,600 | $134,300 | $191,300 |
| 2023 | $4,144 | $307,400 | $127,700 | $179,700 |
| 2022 | $3,886 | $284,300 | $121,100 | $163,200 |
| 2021 | $3,878 | $273,300 | $110,100 | $163,200 |
| 2020 | $3,698 | $273,300 | $110,100 | $163,200 |
| 2019 | $3,652 | $262,900 | $107,900 | $155,000 |
| 2018 | $3,645 | $268,400 | $107,900 | $160,500 |
| 2017 | $3,556 | $269,000 | $107,900 | $161,100 |
| 2016 | $3,545 | $269,000 | $107,900 | $161,100 |
| 2015 | $3,476 | $263,900 | $96,900 | $167,000 |
| 2014 | $3,365 | $265,600 | $96,900 | $168,700 |
Source: Public Records
Map
Nearby Homes
- 18 Elm St
- 34 Gore Ave
- 58 Main St Unit 4
- 58 Main St Unit 3
- 21 Dwight St
- 12 Dwight St
- 0 Straits Rd
- 136 Main St
- 2B Linseed Rd
- 121 West St
- 66 Laurel Park Unit 66
- 93 Laurel Park Unit 93
- 0 Pantry Rd Unit 73430264
- 11 West St
- 0 N Branch Rd
- 32 Stonewall Dr
- 26 Russell St Unit A-B
- 71 Russell St
- 182 Old Stage Rd
- 80 Damon Rd Unit 5104