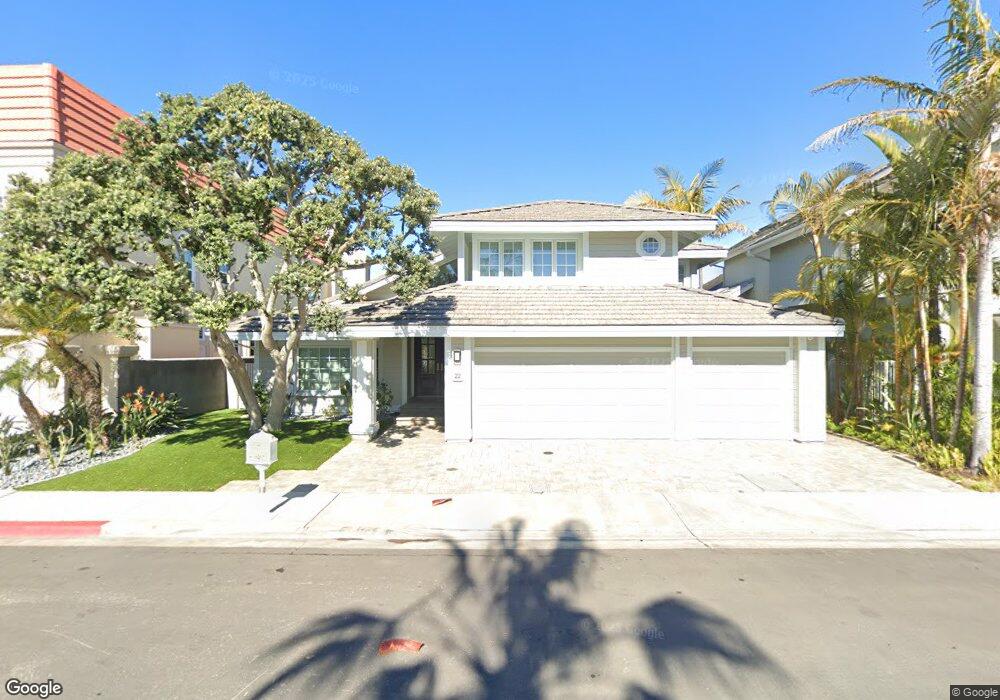
22 Buccaneer Way Coronado, CA 92118
Silver Strand NeighborhoodEstimated Value: $4,513,714 - $5,650,000
5
Beds
5
Baths
5,177
Sq Ft
$931/Sq Ft
Est. Value
About This Home
This home is located at 22 Buccaneer Way, Coronado, CA 92118 and is currently estimated at $4,820,179, approximately $931 per square foot. 22 Buccaneer Way is a home located in San Diego County with nearby schools including Silver Strand Elementary School, Coronado Middle School, and Coronado High School.
Ownership History
Date
Name
Owned For
Owner Type
Purchase Details
Closed on
Mar 22, 2016
Sold by
Milne William James
Bought by
Buccaneer Ventures Llc
Current Estimated Value
Purchase Details
Closed on
Feb 26, 2016
Sold by
Kinchen Kay A
Bought by
Buccaneer Ventures Llc
Purchase Details
Closed on
Dec 28, 2012
Sold by
Kinchen Philip C
Bought by
Kinchen Kay A and Pck Irrevocable Spousal Trust
Purchase Details
Closed on
Aug 31, 2005
Sold by
Nshe Woodlawn Llc
Bought by
Milne William James and Kinchen Philip A
Purchase Details
Closed on
Jul 5, 2005
Sold by
Deasy Paul P and Deasy Betty L
Bought by
Nshe Woodlawn Llc
Purchase Details
Closed on
Mar 13, 1995
Sold by
Cc Wharfage Inc
Bought by
Deasy Paul P and Deasy Betty L
Purchase Details
Closed on
Sep 18, 1992
Purchase Details
Closed on
Oct 2, 1985
Create a Home Valuation Report for This Property
The Home Valuation Report is an in-depth analysis detailing your home's value as well as a comparison with similar homes in the area
Home Values in the Area
Average Home Value in this Area
Purchase History
| Date | Buyer | Sale Price | Title Company |
|---|---|---|---|
| Buccaneer Ventures Llc | -- | Chicago Title Company | |
| Buccaneer Ventures Llc | $1,382,500 | California Title Company | |
| Kinchen Kay A | -- | None Available | |
| Kinchen Philip C | -- | None Available | |
| Milne William James | -- | California Title | |
| Nshe Woodlawn Llc | $3,000,000 | California Title Company | |
| Deasy Paul P | $3,500 | -- | |
| -- | $1,100,000 | -- | |
| -- | $580,000 | -- |
Source: Public Records
Tax History Compared to Growth
Tax History
| Year | Tax Paid | Tax Assessment Tax Assessment Total Assessment is a certain percentage of the fair market value that is determined by local assessors to be the total taxable value of land and additions on the property. | Land | Improvement |
|---|---|---|---|---|
| 2025 | $40,742 | $3,899,443 | $2,208,732 | $1,690,711 |
| 2024 | $40,742 | $3,822,984 | $2,165,424 | $1,657,560 |
| 2023 | $40,084 | $3,748,024 | $2,122,965 | $1,625,059 |
| 2022 | $33,266 | $3,100,000 | $1,951,000 | $1,149,000 |
| 2021 | $29,181 | $2,700,000 | $1,700,000 | $1,000,000 |
| 2020 | $37,617 | $3,565,548 | $2,019,606 | $1,545,942 |
| 2019 | $37,488 | $3,495,636 | $1,980,006 | $1,515,630 |
| 2018 | $36,837 | $3,427,095 | $1,941,183 | $1,485,912 |
| 2017 | $36,200 | $3,359,898 | $1,903,121 | $1,456,777 |
| 2016 | $32,953 | $3,088,038 | $1,731,611 | $1,356,427 |
| 2015 | $32,462 | $3,041,654 | $1,705,601 | $1,336,053 |
| 2014 | $31,715 | $2,982,073 | $1,672,191 | $1,309,882 |
Source: Public Records
Map
Nearby Homes
- 12 Buccaneer Way
- 35 Buccaneer Way
- 8 Buccaneer Way
- 6 Buccaneer Way
- 55 Spinnaker Way
- 45 Saint Christophers Ln
- 3 Aruba Bend
- 94 Kingston Ct W
- 6 Kingston Ct E
- 31 Delaport Ct
- 37 Antigua Ct
- 57 Tunapuna Ln
- 24 Bahama Bend
- 25 Green Turtle Rd
- 8 Admiralty Cross
- 34 The Point
- 1 The Point
- 39 The Point
- 3 The Point
- 54 Half Moon Bend
- 20 Buccaneer Way
- 24 Buccaneer Way
- 18 Buccaneer Way
- 26 Buccaneer Way
- 26 Buccaneer Way Unit 702
- 0 Buccaneer Way Unit 174152
- 0 Buccaneer Way Unit 1 174154
- 28 Buccaneer Way
- 16 Buccaneer Way
- 23 Buccaneer Way
- 21 Buccaneer Way
- 25 Buccaneer Way
- 19 Buccaneer Way
- 30 Buccaneer Way
- 14 Buccaneer Way
- 29 Buccaneer Way
- 17 Buccaneer Way
- 15 Buccaneer Way
- 31 Buccaneer Way
- 46 Blue Anchor Cay Rd