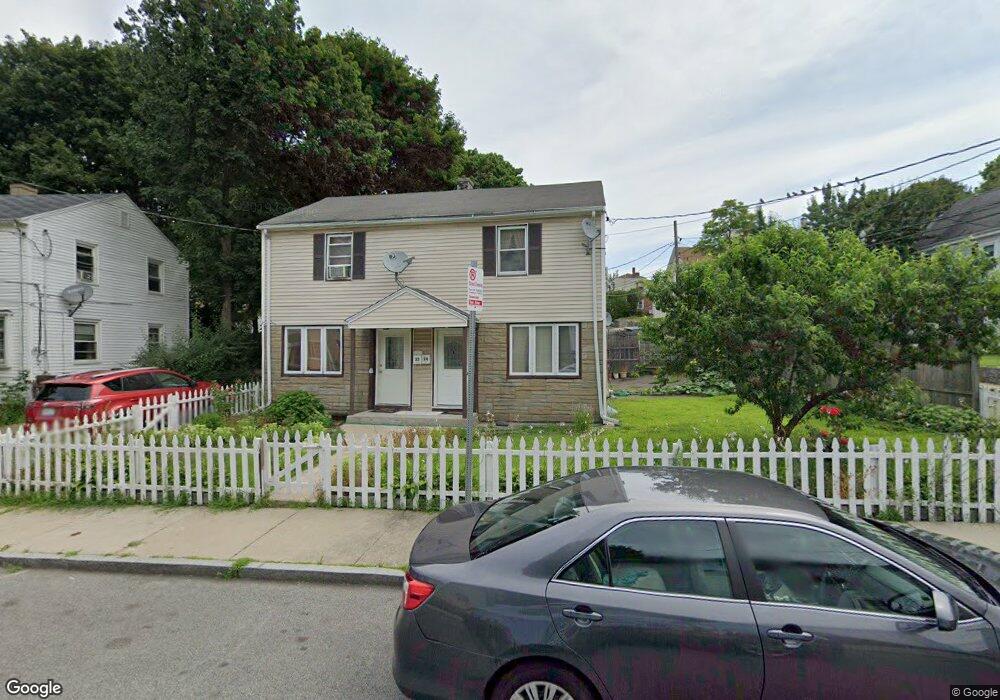
22 Caddy Rd Mattapan, MA 02126
West Codman Hill-West Lowe NeighborhoodEstimated Value: $726,532 - $860,000
4
Beds
2
Baths
1,536
Sq Ft
$529/Sq Ft
Est. Value
About This Home
This home is located at 22 Caddy Rd, Mattapan, MA 02126 and is currently estimated at $812,383, approximately $528 per square foot. 22 Caddy Rd is a home located in Suffolk County with nearby schools including Conservatory Lab Upper School and Saint John Paul II Catholic Academy.
Ownership History
Date
Name
Owned For
Owner Type
Purchase Details
Closed on
Oct 6, 2005
Sold by
Hernandez Maria L
Bought by
Toppin Marva L
Current Estimated Value
Home Financials for this Owner
Home Financials are based on the most recent Mortgage that was taken out on this home.
Original Mortgage
$348,800
Outstanding Balance
$187,282
Interest Rate
5.81%
Mortgage Type
Purchase Money Mortgage
Estimated Equity
$625,101
Purchase Details
Closed on
Feb 13, 2004
Sold by
Derolus Marie E
Bought by
Hernandez Maria L
Home Financials for this Owner
Home Financials are based on the most recent Mortgage that was taken out on this home.
Original Mortgage
$348,500
Interest Rate
5.82%
Mortgage Type
Purchase Money Mortgage
Purchase Details
Closed on
Feb 2, 1999
Sold by
Michel Jacky and Michel Adeline
Bought by
Derolus Marie E
Purchase Details
Closed on
May 27, 1988
Sold by
Larionne Ercilien
Bought by
Michel Jacky
Create a Home Valuation Report for This Property
The Home Valuation Report is an in-depth analysis detailing your home's value as well as a comparison with similar homes in the area
Home Values in the Area
Average Home Value in this Area
Purchase History
| Date | Buyer | Sale Price | Title Company |
|---|---|---|---|
| Toppin Marva L | $436,000 | -- | |
| Hernandez Maria L | $410,000 | -- | |
| Derolus Marie E | $140,000 | -- | |
| Michel Jacky | $140,000 | -- |
Source: Public Records
Mortgage History
| Date | Status | Borrower | Loan Amount |
|---|---|---|---|
| Open | Toppin Marva L | $348,800 | |
| Previous Owner | Michel Jacky | $5,750 | |
| Previous Owner | Michel Jacky | $348,500 | |
| Previous Owner | Michel Jacky | $154,128 |
Source: Public Records
Tax History Compared to Growth
Tax History
| Year | Tax Paid | Tax Assessment Tax Assessment Total Assessment is a certain percentage of the fair market value that is determined by local assessors to be the total taxable value of land and additions on the property. | Land | Improvement |
|---|---|---|---|---|
| 2025 | $7,723 | $666,900 | $218,800 | $448,100 |
| 2024 | $7,779 | $713,700 | $207,500 | $506,200 |
| 2023 | $7,034 | $654,900 | $190,400 | $464,500 |
| 2022 | $6,535 | $600,600 | $174,600 | $426,000 |
| 2021 | $6,284 | $588,900 | $171,200 | $417,700 |
| 2020 | $5,297 | $501,600 | $168,200 | $333,400 |
| 2019 | $4,804 | $455,800 | $126,200 | $329,600 |
| 2018 | $4,548 | $434,000 | $126,200 | $307,800 |
| 2017 | $4,254 | $401,700 | $126,200 | $275,500 |
| 2016 | $4,129 | $375,400 | $126,200 | $249,200 |
| 2015 | $3,559 | $293,900 | $114,900 | $179,000 |
| 2014 | $3,390 | $269,500 | $114,900 | $154,600 |
Source: Public Records
Map
Nearby Homes
- 32-32R Temple St
- 8-14R Temple St
- 67 Idaho St
- 1245 Adams St Unit B406
- 1245 Adams St Unit B210
- 131 Eliot St Unit 312
- 131 Eliot St Unit 408
- 131 Eliot St Unit 305
- 36 Oakridge St
- 30 Pleasant Hill Ave Unit 32
- 21A High St Unit 2
- 4 School St
- 23 Maryknoll St
- 84-86 Codman Hill Ave
- 14 Valley Rd
- 22 Branchfield St Unit D4
- 56 Fairmount St Unit 2
- 2089 Dorchester Ave Unit 1
- 2089 Dorchester Ave Unit 2
- 147 Fairmount St
- 18 Caddy Rd Unit 20
- 11 Monson St
- 17 Monson St
- 16 Caddy Rd Unit 16
- 14 Monson St
- 14 Monson St Unit L
- 21 Caddy Rd Unit 1
- 21 Caddy Rd Unit 21
- 23 Caddy Rd Unit 25
- 7 Monson St
- 12 Monson St
- 19 Caddy Rd Unit 21
- 12 Caddy Rd
- 12 Caddy Rd Unit 12
- 19 Monson St
- 16 Monson St
- 8 Monson St Unit 10
- 10 Caddy Rd
- 13 Caddy Rd Unit 15
- 15 Caddy Rd