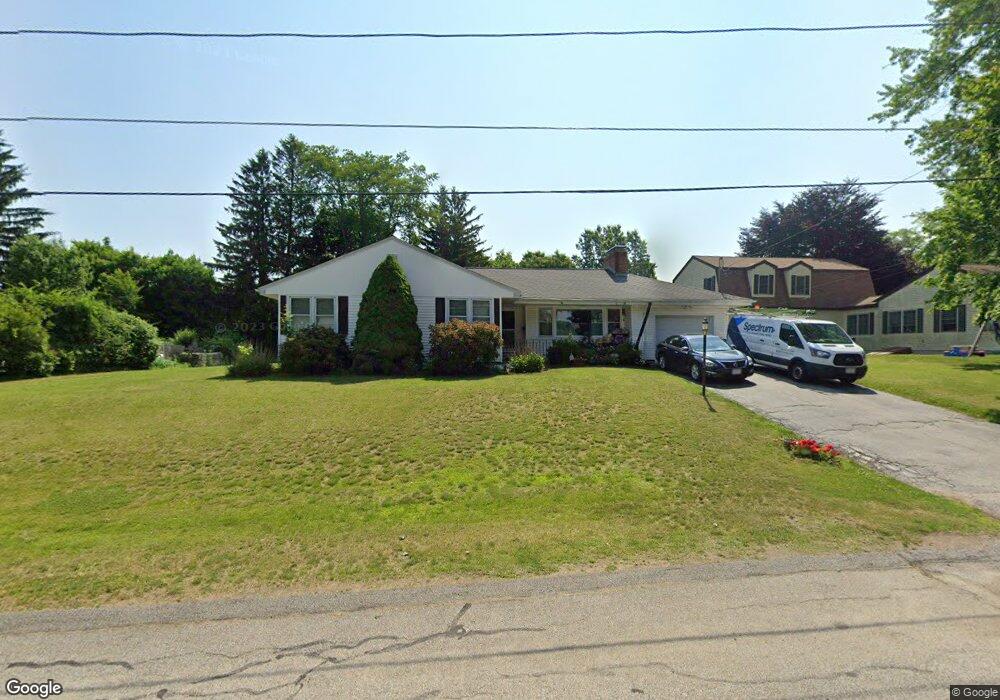
22 Carroll St Auburn, MA 01501
Stoneville NeighborhoodEstimated Value: $449,000 - $483,000
3
Beds
3
Baths
1,349
Sq Ft
$345/Sq Ft
Est. Value
About This Home
This home is located at 22 Carroll St, Auburn, MA 01501 and is currently estimated at $465,175, approximately $344 per square foot. 22 Carroll St is a home located in Worcester County with nearby schools including Auburn Senior High School, Canterbury Street School, and Shrewsbury Montessori School - Auburn Campus.
Ownership History
Date
Name
Owned For
Owner Type
Purchase Details
Closed on
Sep 25, 1998
Sold by
Est Scott Francis X and Fellenz Catherine M
Bought by
Hearnlaye Wayne A and Hearnlaye Tammy M
Current Estimated Value
Home Financials for this Owner
Home Financials are based on the most recent Mortgage that was taken out on this home.
Original Mortgage
$121,500
Interest Rate
6.87%
Mortgage Type
Purchase Money Mortgage
Create a Home Valuation Report for This Property
The Home Valuation Report is an in-depth analysis detailing your home's value as well as a comparison with similar homes in the area
Home Values in the Area
Average Home Value in this Area
Purchase History
| Date | Buyer | Sale Price | Title Company |
|---|---|---|---|
| Hearnlaye Wayne A | $135,000 | -- |
Source: Public Records
Mortgage History
| Date | Status | Borrower | Loan Amount |
|---|---|---|---|
| Open | Hearnlaye Wayne A | $160,000 | |
| Closed | Hearnlaye Wayne A | $132,500 | |
| Closed | Hearnlaye Wayne A | $15,000 | |
| Closed | Hearnlaye Wayne A | $121,500 |
Source: Public Records
Tax History Compared to Growth
Tax History
| Year | Tax Paid | Tax Assessment Tax Assessment Total Assessment is a certain percentage of the fair market value that is determined by local assessors to be the total taxable value of land and additions on the property. | Land | Improvement |
|---|---|---|---|---|
| 2025 | $59 | $409,500 | $127,900 | $281,600 |
| 2024 | $5,971 | $399,900 | $122,600 | $277,300 |
| 2023 | $5,760 | $362,700 | $111,500 | $251,200 |
| 2022 | $5,379 | $319,800 | $111,500 | $208,300 |
| 2021 | $22 | $285,800 | $98,400 | $187,400 |
| 2020 | $5,148 | $286,300 | $98,400 | $187,900 |
| 2019 | $4,970 | $269,800 | $97,500 | $172,300 |
| 2018 | $6 | $257,400 | $91,200 | $166,200 |
| 2017 | $4,565 | $248,900 | $82,700 | $166,200 |
| 2016 | $4,289 | $237,100 | $85,800 | $151,300 |
| 2015 | $3,966 | $229,800 | $85,800 | $144,000 |
| 2014 | $3,745 | $216,600 | $81,700 | $134,900 |
Source: Public Records
Map
Nearby Homes
- 2 Keen St
- 176 Boyce St
- 177 Boyce St
- 4 S Edlin St
- 5 Commonwealth Ave
- 8 Shirley St
- 25 Vinal St Unit 26
- 25 Vinal St Unit 29
- 25 Vinal St Unit 30
- 53 James St
- 27 Havana Rd
- 24 Meena Dr
- 35 Genessee St Unit I
- 177 Oxford St N
- 20 Alpine Trail
- 315 Stafford St
- 170 Stafford St
- 114 Henshaw St
- 34 Rockland Rd
- 40 Ludlow St