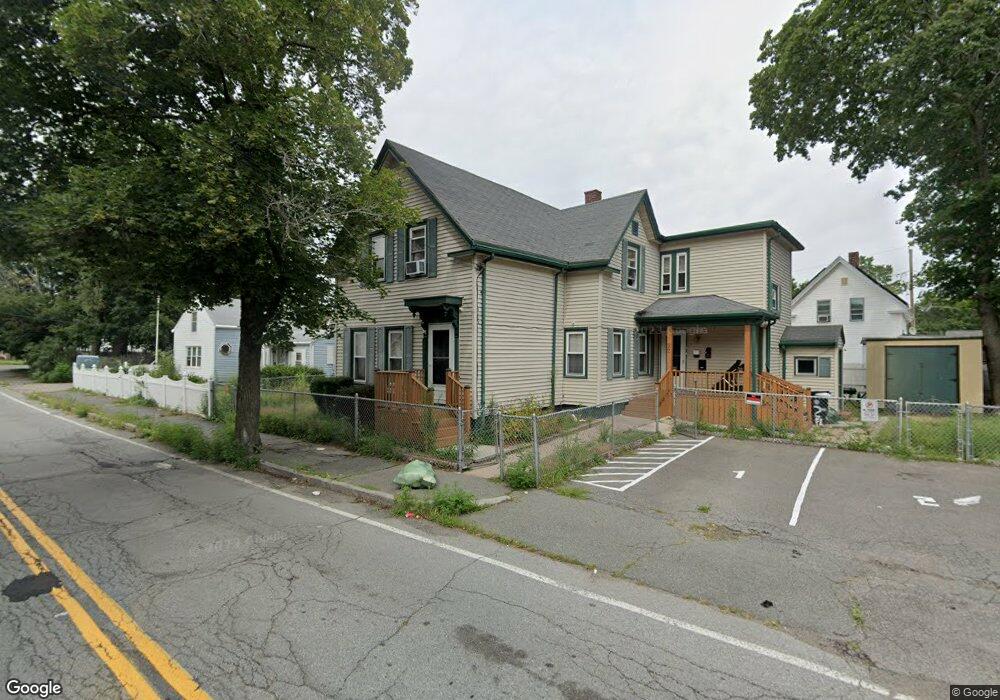
22 Clinton St Unit 2 Brockton, MA 02302
Clifton Heights NeighborhoodEstimated Value: $598,766 - $728,000
3
Beds
1
Bath
1,200
Sq Ft
$540/Sq Ft
Est. Value
About This Home
This home is located at 22 Clinton St Unit 2, Brockton, MA 02302 and is currently estimated at $647,442, approximately $539 per square foot. 22 Clinton St Unit 2 is a home located in Plymouth County with nearby schools including Davis K-8 School, John F. Kennedy Elementary School, and South Middle School.
Ownership History
Date
Name
Owned For
Owner Type
Purchase Details
Closed on
Dec 19, 2018
Sold by
Reed John R and Reed Janet E
Bought by
Bruno Jean G
Current Estimated Value
Home Financials for this Owner
Home Financials are based on the most recent Mortgage that was taken out on this home.
Original Mortgage
$347,588
Outstanding Balance
$305,924
Interest Rate
4.75%
Mortgage Type
FHA
Estimated Equity
$341,518
Create a Home Valuation Report for This Property
The Home Valuation Report is an in-depth analysis detailing your home's value as well as a comparison with similar homes in the area
Home Values in the Area
Average Home Value in this Area
Purchase History
| Date | Buyer | Sale Price | Title Company |
|---|---|---|---|
| Bruno Jean G | $354,000 | -- |
Source: Public Records
Mortgage History
| Date | Status | Borrower | Loan Amount |
|---|---|---|---|
| Open | Bruno Jean G | $347,588 |
Source: Public Records
Tax History Compared to Growth
Tax History
| Year | Tax Paid | Tax Assessment Tax Assessment Total Assessment is a certain percentage of the fair market value that is determined by local assessors to be the total taxable value of land and additions on the property. | Land | Improvement |
|---|---|---|---|---|
| 2025 | $6,932 | $572,400 | $135,000 | $437,400 |
| 2024 | $6,903 | $574,300 | $135,000 | $439,300 |
| 2023 | $6,317 | $486,700 | $101,300 | $385,400 |
| 2022 | $6,298 | $450,800 | $91,800 | $359,000 |
| 2021 | $5,526 | $381,100 | $75,800 | $305,300 |
| 2020 | $5,077 | $335,100 | $71,600 | $263,500 |
| 2019 | $4,959 | $319,100 | $69,000 | $250,100 |
| 2018 | $3,967 | $289,000 | $69,000 | $220,000 |
| 2017 | $3,967 | $246,400 | $69,000 | $177,400 |
| 2016 | $3,496 | $201,400 | $66,900 | $134,500 |
| 2015 | $2,984 | $164,400 | $66,900 | $97,500 |
| 2014 | $2,741 | $151,200 | $66,900 | $84,300 |
Source: Public Records
Map
Nearby Homes