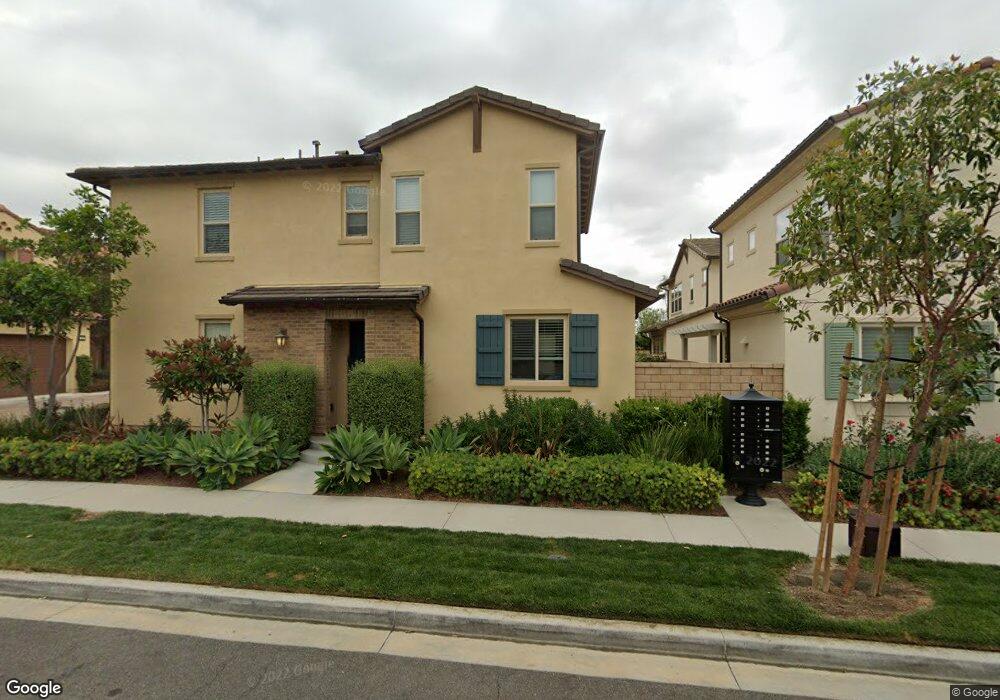
22 Clover Lake Forest, CA 92630
Baker Ranch NeighborhoodEstimated Value: $1,243,014 - $1,428,000
3
Beds
3
Baths
1,705
Sq Ft
$783/Sq Ft
Est. Value
About This Home
This home is located at 22 Clover, Lake Forest, CA 92630 and is currently estimated at $1,335,254, approximately $783 per square foot. 22 Clover is a home with nearby schools including Foothill Ranch Elementary School, Serrano Intermediate School, and El Toro High School.
Ownership History
Date
Name
Owned For
Owner Type
Purchase Details
Closed on
Jul 6, 2021
Sold by
Chao Jeffrey and Chalaban Annie
Bought by
Chao Jeffrey and Chalaban Annie
Current Estimated Value
Purchase Details
Closed on
Sep 15, 2015
Sold by
Shea Homes Limited Partnership
Bought by
Chao Jeffrey and Chalaban Annie
Home Financials for this Owner
Home Financials are based on the most recent Mortgage that was taken out on this home.
Original Mortgage
$545,000
Outstanding Balance
$427,916
Interest Rate
3.9%
Mortgage Type
New Conventional
Estimated Equity
$907,338
Create a Home Valuation Report for This Property
The Home Valuation Report is an in-depth analysis detailing your home's value as well as a comparison with similar homes in the area
Home Values in the Area
Average Home Value in this Area
Purchase History
| Date | Buyer | Sale Price | Title Company |
|---|---|---|---|
| Chao Jeffrey | -- | None Available | |
| Chao Jeffrey | $682,000 | Fntg |
Source: Public Records
Mortgage History
| Date | Status | Borrower | Loan Amount |
|---|---|---|---|
| Open | Chao Jeffrey | $545,000 |
Source: Public Records
Tax History
| Year | Tax Paid | Tax Assessment Tax Assessment Total Assessment is a certain percentage of the fair market value that is determined by local assessors to be the total taxable value of land and additions on the property. | Land | Improvement |
|---|---|---|---|---|
| 2025 | $8,399 | $807,316 | $493,001 | $314,315 |
| 2024 | $8,399 | $791,487 | $483,335 | $308,152 |
| 2023 | $8,201 | $775,968 | $473,858 | $302,110 |
| 2022 | $8,055 | $760,753 | $464,566 | $296,187 |
| 2021 | $7,895 | $745,837 | $455,457 | $290,380 |
| 2020 | $7,824 | $738,190 | $450,787 | $287,403 |
| 2019 | $7,808 | $723,716 | $441,948 | $281,768 |
| 2018 | $7,662 | $709,526 | $433,282 | $276,244 |
| 2017 | $7,510 | $695,614 | $424,786 | $270,828 |
| 2016 | $7,152 | $681,975 | $416,457 | $265,518 |
| 2015 | $1,715 | $160,292 | $160,292 | $0 |
| 2014 | $674 | $62,367 | $62,367 | $0 |
Source: Public Records
Map
Nearby Homes
Your Personal Tour Guide
Ask me questions while you tour the home.