Estimated Value: $175,000 - $199,000
--
Bed
3
Baths
1,794
Sq Ft
$104/Sq Ft
Est. Value
About This Home
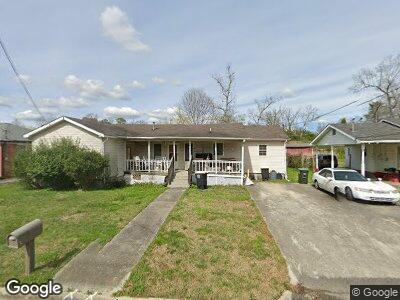
This home is located at 22 Conn St SW, Rome, GA 30165 and is currently estimated at $186,760, approximately $104 per square foot. 22 Conn St SW is a home located in Floyd County with nearby schools including Rome High School and Darlington School.
Ownership History
Date
Name
Owned For
Owner Type
Purchase Details
Closed on
Nov 30, 1995
Sold by
Ely Mary E
Bought by
Almond Tina E
Current Estimated Value
Purchase Details
Closed on
Jun 1, 1989
Sold by
Mullinax Kathy Knowles
Bought by
Ely Mary E
Purchase Details
Closed on
Jan 19, 1984
Sold by
Morrison Danny Joe and Morrison Sandra
Bought by
Mullinax Kathy Knowles
Purchase Details
Closed on
Jul 1, 1976
Sold by
Payne Bobby Ferren and Myra Jean
Bought by
Morrison Danny Joe and Morrison Sandra
Purchase Details
Closed on
Feb 22, 1972
Sold by
Fed Nat Mor Assos Adm Vet Affairs
Bought by
Payne Bobby Ferren and Myra Jean
Purchase Details
Closed on
Aug 21, 1971
Bought by
P and R
Purchase Details
Closed on
Aug 20, 1971
Sold by
Simpson Dennis Lynn and Simpson Dorothy
Bought by
Fed Nat Mor Assos Adm Vet Affairs
Purchase Details
Closed on
Mar 29, 1968
Sold by
Lee Harold
Bought by
Simpson Dennis Lynn and Simpson Dorothy
Purchase Details
Closed on
Dec 30, 1953
Bought by
Lee Harold
Create a Home Valuation Report for This Property
The Home Valuation Report is an in-depth analysis detailing your home's value as well as a comparison with similar homes in the area
Home Values in the Area
Average Home Value in this Area
Purchase History
| Date | Buyer | Sale Price | Title Company |
|---|---|---|---|
| Almond Tina E | $49,900 | -- | |
| Ely Mary E | -- | -- | |
| Mullinax Kathy Knowles | $25,900 | -- | |
| Morrison Danny Joe | $21,700 | -- | |
| Payne Bobby Ferren | $12,500 | -- | |
| P | -- | -- | |
| Fed Nat Mor Assos Adm Vet Affairs | $12,100 | -- | |
| Simpson Dennis Lynn | $12,100 | -- | |
| Lee Harold | -- | -- |
Source: Public Records
Tax History Compared to Growth
Tax History
| Year | Tax Paid | Tax Assessment Tax Assessment Total Assessment is a certain percentage of the fair market value that is determined by local assessors to be the total taxable value of land and additions on the property. | Land | Improvement |
|---|---|---|---|---|
| 2024 | $1,703 | $65,465 | $8,100 | $57,365 |
| 2023 | $1,640 | $62,122 | $7,200 | $54,922 |
| 2022 | $1,511 | $51,398 | $6,000 | $45,398 |
| 2021 | $1,421 | $45,833 | $6,000 | $39,833 |
| 2020 | $1,363 | $41,950 | $4,500 | $37,450 |
| 2019 | $1,310 | $39,567 | $4,500 | $35,067 |
| 2018 | $1,269 | $37,213 | $4,500 | $32,713 |
| 2017 | $1,245 | $35,782 | $4,500 | $31,282 |
| 2016 | $1,230 | $34,744 | $4,480 | $30,264 |
| 2015 | $1,164 | $34,744 | $4,480 | $30,264 |
| 2014 | $1,164 | $34,744 | $4,480 | $30,264 |
Source: Public Records
Map
Nearby Homes
- 103 Wooten Dr SW
- 20 Burnett Ferry Rd SW
- 10 Wingfield St SW
- 0 Cedartown Rd Unit 10479932
- 0 Lexington Ln Unit 7312028
- 0 Lexington Ln Unit 10133164
- 104 Dellwood Dr NW
- 10 Leon St SW
- 3 Pebble Bend Ct
- 43 Westwood Cir SW
- 2 Castlewood Dr SW
- 122 Payne Rd SW
- 123 Nanellen Rd SW
- 7 Texas Ave NW
- 438 Wilkerson Rd SW
- 107 Kirton St NW
- 101 Garrard Ave NW
- 23 Westwood Cir SW
- 7 Hawk Spring Dr SW