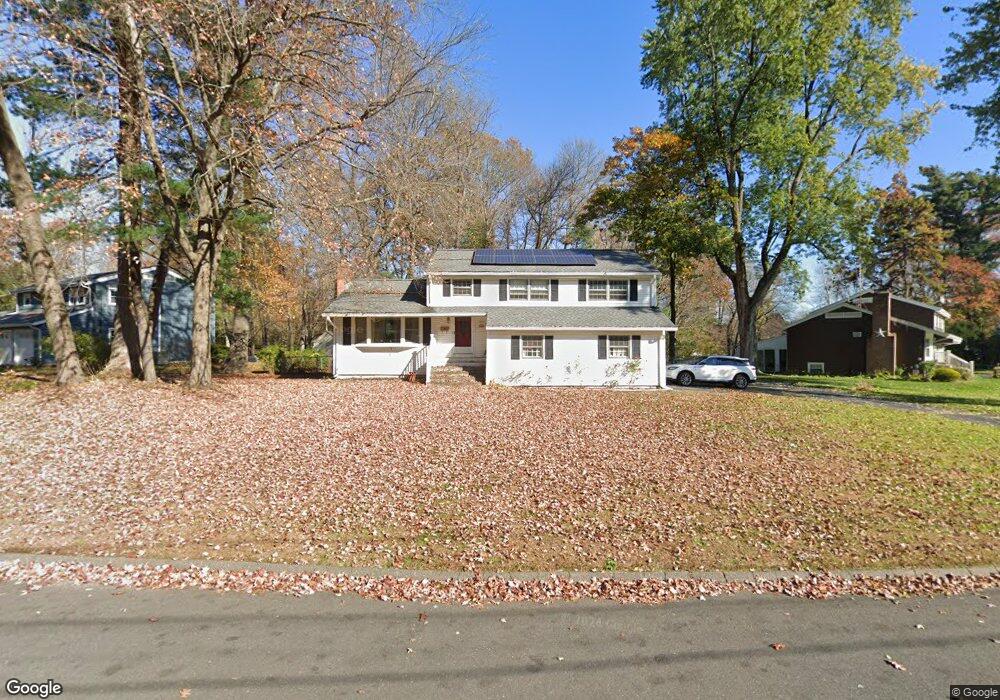
22 Diana Ln Windsor, CT 06095
West Windsor NeighborhoodEstimated Value: $373,189 - $431,000
4
Beds
3
Baths
1,748
Sq Ft
$228/Sq Ft
Est. Value
About This Home
This home is located at 22 Diana Ln, Windsor, CT 06095 and is currently estimated at $398,547, approximately $228 per square foot. 22 Diana Ln is a home located in Hartford County with nearby schools including Poquonock Elementary School, Clover Street School, and Sage Park Middle School.
Ownership History
Date
Name
Owned For
Owner Type
Purchase Details
Closed on
Apr 29, 1997
Sold by
Burr Keith and Burr Debra
Bought by
Washington Gerald and Washington Thelma
Current Estimated Value
Purchase Details
Closed on
Sep 21, 1992
Sold by
Frenchette Richard and Frenchette C
Bought by
Burr Keith and Burr Debra
Create a Home Valuation Report for This Property
The Home Valuation Report is an in-depth analysis detailing your home's value as well as a comparison with similar homes in the area
Home Values in the Area
Average Home Value in this Area
Purchase History
| Date | Buyer | Sale Price | Title Company |
|---|---|---|---|
| Washington Gerald | $140,000 | -- | |
| Burr Keith | $158,800 | -- |
Source: Public Records
Mortgage History
| Date | Status | Borrower | Loan Amount |
|---|---|---|---|
| Open | Burr Keith | $152,000 | |
| Closed | Burr Keith | $99,332 | |
| Closed | Burr Keith | $20,000 |
Source: Public Records
Tax History Compared to Growth
Tax History
| Year | Tax Paid | Tax Assessment Tax Assessment Total Assessment is a certain percentage of the fair market value that is determined by local assessors to be the total taxable value of land and additions on the property. | Land | Improvement |
|---|---|---|---|---|
| 2025 | $6,000 | $210,910 | $64,400 | $146,510 |
| 2024 | $6,395 | $210,910 | $64,400 | $146,510 |
| 2023 | $5,137 | $152,880 | $50,750 | $102,130 |
| 2022 | $5,086 | $152,880 | $50,750 | $102,130 |
| 2021 | $5,086 | $152,880 | $50,750 | $102,130 |
| 2020 | $5,062 | $152,880 | $50,750 | $102,130 |
| 2019 | $4,950 | $152,880 | $50,750 | $102,130 |
| 2018 | $4,626 | $140,350 | $50,750 | $89,600 |
| 2017 | $4,554 | $140,350 | $50,750 | $89,600 |
| 2016 | $4,424 | $140,350 | $50,750 | $89,600 |
| 2015 | $4,340 | $140,350 | $50,750 | $89,600 |
| 2014 | $4,276 | $140,350 | $50,750 | $89,600 |
Source: Public Records
Map
Nearby Homes