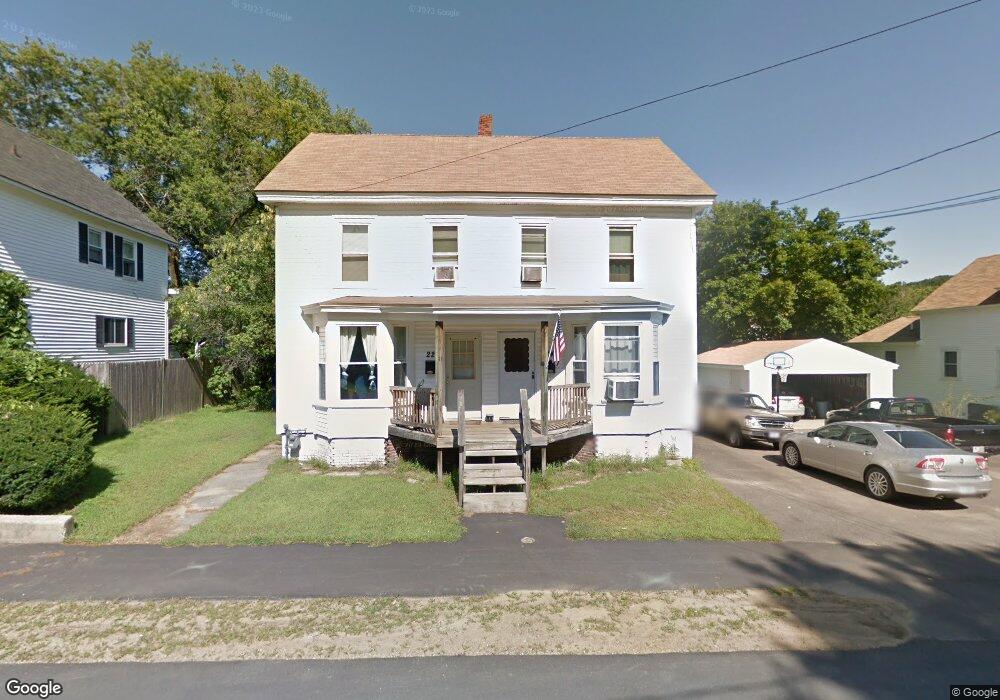
22 Dolloff St Laconia, NH 03246
Estimated Value: $385,000 - $469,000
4
Beds
2
Baths
2,213
Sq Ft
$189/Sq Ft
Est. Value
About This Home
This home is located at 22 Dolloff St, Laconia, NH 03246 and is currently estimated at $419,117, approximately $189 per square foot. 22 Dolloff St is a home located in Belknap County with nearby schools including Laconia Middle School, Laconia High School, and Holy Trinity Catholic School.
Ownership History
Date
Name
Owned For
Owner Type
Purchase Details
Closed on
Apr 1, 2022
Sold by
Paquet Jonathan L
Bought by
Paquet Jonathan L and Paquet Tina A
Current Estimated Value
Home Financials for this Owner
Home Financials are based on the most recent Mortgage that was taken out on this home.
Original Mortgage
$180,000
Outstanding Balance
$169,806
Interest Rate
4.67%
Mortgage Type
Stand Alone Refi Refinance Of Original Loan
Estimated Equity
$249,311
Create a Home Valuation Report for This Property
The Home Valuation Report is an in-depth analysis detailing your home's value as well as a comparison with similar homes in the area
Home Values in the Area
Average Home Value in this Area
Purchase History
| Date | Buyer | Sale Price | Title Company |
|---|---|---|---|
| Paquet Jonathan L | -- | None Available | |
| Paquet Jonathan L | -- | None Available |
Source: Public Records
Mortgage History
| Date | Status | Borrower | Loan Amount |
|---|---|---|---|
| Open | Paquet Jonathan L | $180,000 | |
| Closed | Paquet Jonathan L | $180,000 |
Source: Public Records
Tax History Compared to Growth
Tax History
| Year | Tax Paid | Tax Assessment Tax Assessment Total Assessment is a certain percentage of the fair market value that is determined by local assessors to be the total taxable value of land and additions on the property. | Land | Improvement |
|---|---|---|---|---|
| 2024 | $4,649 | $341,100 | $129,300 | $211,800 |
| 2023 | $4,333 | $311,500 | $118,500 | $193,000 |
| 2022 | $3,659 | $246,400 | $100,500 | $145,900 |
| 2021 | $3,717 | $197,100 | $66,100 | $131,000 |
| 2020 | $3,486 | $176,800 | $56,300 | $120,500 |
| 2019 | $3,305 | $160,500 | $51,400 | $109,100 |
| 2018 | $3,286 | $157,600 | $50,000 | $107,600 |
| 2017 | $3,293 | $156,600 | $49,000 | $107,600 |
| 2016 | $3,312 | $149,200 | $49,000 | $100,200 |
| 2015 | $3,201 | $144,200 | $51,500 | $92,700 |
| 2014 | $3,394 | $151,500 | $51,300 | $100,200 |
| 2013 | $3,286 | $148,800 | $48,600 | $100,200 |
Source: Public Records
Map
Nearby Homes