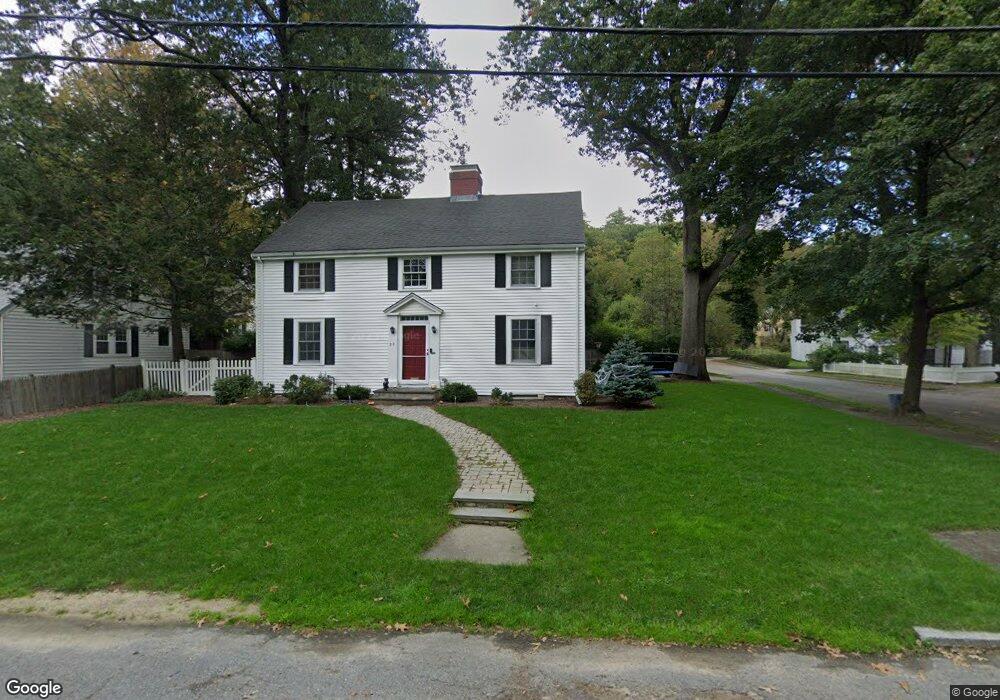
22 Dwhinda Rd Waban, MA 02468
Waban NeighborhoodEstimated Value: $1,632,000 - $2,180,000
3
Beds
3
Baths
2,278
Sq Ft
$864/Sq Ft
Est. Value
About This Home
This home is located at 22 Dwhinda Rd, Waban, MA 02468 and is currently estimated at $1,969,070, approximately $864 per square foot. 22 Dwhinda Rd is a home located in Middlesex County with nearby schools including Angier Elementary School, Charles E Brown Middle School, and Newton South High School.
Ownership History
Date
Name
Owned For
Owner Type
Purchase Details
Closed on
Jun 4, 2007
Sold by
Whalen John L and Whalen Kathryn S
Bought by
Benson Robert L
Current Estimated Value
Home Financials for this Owner
Home Financials are based on the most recent Mortgage that was taken out on this home.
Original Mortgage
$417,000
Outstanding Balance
$255,850
Interest Rate
6.24%
Mortgage Type
Purchase Money Mortgage
Estimated Equity
$1,713,220
Create a Home Valuation Report for This Property
The Home Valuation Report is an in-depth analysis detailing your home's value as well as a comparison with similar homes in the area
Home Values in the Area
Average Home Value in this Area
Purchase History
| Date | Buyer | Sale Price | Title Company |
|---|---|---|---|
| Benson Robert L | $742,600 | -- |
Source: Public Records
Mortgage History
| Date | Status | Borrower | Loan Amount |
|---|---|---|---|
| Open | Benson Robert L | $417,000 |
Source: Public Records
Tax History
| Year | Tax Paid | Tax Assessment Tax Assessment Total Assessment is a certain percentage of the fair market value that is determined by local assessors to be the total taxable value of land and additions on the property. | Land | Improvement |
|---|---|---|---|---|
| 2025 | $18,230 | $1,860,200 | $1,320,200 | $540,000 |
| 2024 | $17,542 | $1,797,300 | $1,281,700 | $515,600 |
| 2023 | $16,755 | $1,645,900 | $988,700 | $657,200 |
| 2022 | $16,032 | $1,524,000 | $915,500 | $608,500 |
| 2021 | $15,470 | $1,437,700 | $863,700 | $574,000 |
| 2020 | $15,010 | $1,437,700 | $863,700 | $574,000 |
| 2019 | $13,563 | $1,297,900 | $838,500 | $459,400 |
| 2018 | $13,278 | $1,227,200 | $762,600 | $464,600 |
| 2017 | $12,874 | $1,157,700 | $719,400 | $438,300 |
| 2016 | $12,313 | $1,082,000 | $672,300 | $409,700 |
| 2015 | $11,740 | $1,011,200 | $628,300 | $382,900 |
Source: Public Records
Map
Nearby Homes
- 177 Varick Rd
- 26 Varick Hill Rd
- 64 Varick Rd
- 447 Waban Ave
- 31 Wilde Rd
- 8 Damien Rd
- 32 Lantern Ln
- 0 Metacomet Rd
- 33 Metacomet Rd
- 91 Waban Ave
- 71 Fairbanks Ave
- 577 Grove St
- 10 Fife Rd
- 96 Washburn Ave
- 20 Kinmonth Rd Unit 203
- 20 Kinmonth Rd Unit 306
- 20 Kinmonth Rd Unit 4
- 5 Tennyson Rd
- 181 Saint Mary St
- 187 Saint Mary St
Your Personal Tour Guide
Ask me questions while you tour the home.