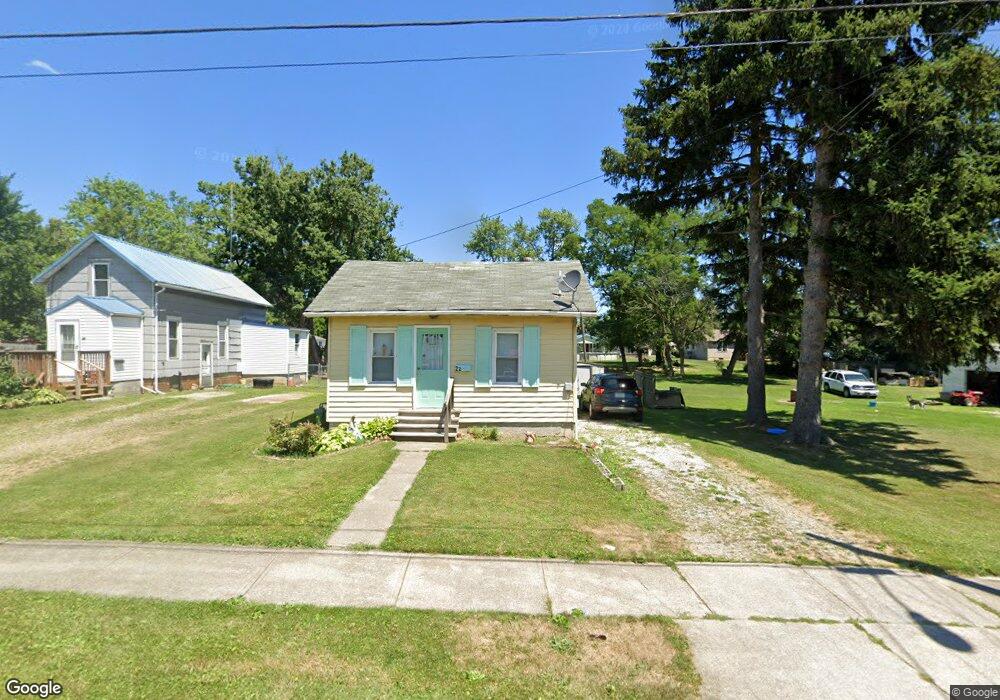
22 E 12th St Ashland, OH 44805
Estimated Value: $78,697 - $118,000
2
Beds
1
Bath
588
Sq Ft
$162/Sq Ft
Est. Value
About This Home
This home is located at 22 E 12th St, Ashland, OH 44805 and is currently estimated at $95,424, approximately $162 per square foot. 22 E 12th St is a home located in Ashland County with nearby schools including Ashland High School, Ashland County Community Academy, and St. Edward Elementary School.
Ownership History
Date
Name
Owned For
Owner Type
Purchase Details
Closed on
Jun 12, 2024
Sold by
Hartsel Glenna
Bought by
Hartsel Glenna
Current Estimated Value
Purchase Details
Closed on
Jun 27, 2018
Sold by
James Peter L
Bought by
Hartsel Glenna
Purchase Details
Closed on
Aug 27, 2009
Sold by
James Peter Lee
Purchase Details
Closed on
Apr 28, 2008
Bought by
James Peter Lee
Purchase Details
Closed on
Jun 25, 2004
Sold by
Workman Kenneth E
Bought by
Krupar Andrew J
Purchase Details
Closed on
Jan 1, 1990
Bought by
Workman Kenneth E
Create a Home Valuation Report for This Property
The Home Valuation Report is an in-depth analysis detailing your home's value as well as a comparison with similar homes in the area
Home Values in the Area
Average Home Value in this Area
Purchase History
| Date | Buyer | Sale Price | Title Company |
|---|---|---|---|
| Hartsel Glenna | -- | None Listed On Document | |
| Hartsel Glenna | $21,000 | -- | |
| -- | $46,000 | -- | |
| James Peter Lee | $46,000 | -- | |
| Krupar Andrew J | $15,000 | -- | |
| Workman Kenneth E | -- | -- |
Source: Public Records
Tax History
| Year | Tax Paid | Tax Assessment Tax Assessment Total Assessment is a certain percentage of the fair market value that is determined by local assessors to be the total taxable value of land and additions on the property. | Land | Improvement |
|---|---|---|---|---|
| 2025 | $110 | $12,930 | $4,610 | $8,320 |
| 2024 | $110 | $12,930 | $4,610 | $8,320 |
| 2023 | $110 | $12,930 | $4,610 | $8,320 |
| 2022 | $58 | $9,950 | $3,550 | $6,400 |
| 2021 | $58 | $9,950 | $3,550 | $6,400 |
| 2020 | $56 | $9,950 | $3,550 | $6,400 |
| 2019 | $14 | $8,920 | $3,730 | $5,190 |
| 2018 | $14 | $8,920 | $3,730 | $5,190 |
| 2017 | $6 | $8,920 | $3,730 | $5,190 |
| 2016 | $6 | $7,750 | $3,240 | $4,510 |
| 2015 | $379 | $7,750 | $3,240 | $4,510 |
| 2013 | $502 | $9,580 | $3,260 | $6,320 |
Source: Public Records
Map
Nearby Homes
- 1471 Troy Rd
- 1411 Orange Rd
- 237 E 9th St
- 304 Prospect St
- 410 E 9th St
- 1218 Myers Ave
- 1520 Orange Rd Unit 22
- 1520 Orange Rd
- 416-418 Carroll St
- 945 Virginia Ave
- 0 Virginia Ave Unit 230908
- 515 Sandusky St
- 427 W Main St
- 64 Harold Dr
- 67 Harold Dr
- 219 W Washington St
- 16 Terrace Dr
- 99 Harold Dr
- 102 E Liberty St
- 934 Summit Dr
Your Personal Tour Guide
Ask me questions while you tour the home.