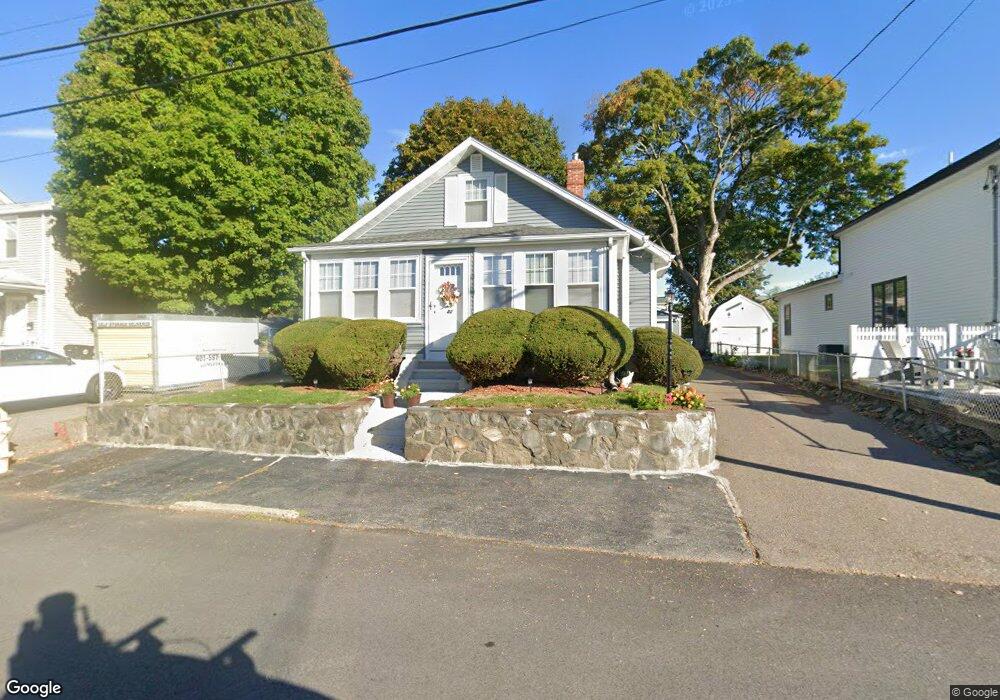
22 E Earle St Cumberland, RI 02864
Valley Falls NeighborhoodEstimated Value: $404,159 - $456,000
3
Beds
1
Bath
1,256
Sq Ft
$341/Sq Ft
Est. Value
About This Home
This home is located at 22 E Earle St, Cumberland, RI 02864 and is currently estimated at $428,540, approximately $341 per square foot. 22 E Earle St is a home located in Providence County with nearby schools including B.F. Norton Elementary School, Joseph L. McCourt Middle School, and Cumberland High School.
Ownership History
Date
Name
Owned For
Owner Type
Purchase Details
Closed on
Apr 30, 2025
Sold by
Conway James T and Conway Ethel A
Bought by
James T T and James Ethel A
Current Estimated Value
Purchase Details
Closed on
Feb 12, 1969
Bought by
Conway James T and Conway Ethel
Create a Home Valuation Report for This Property
The Home Valuation Report is an in-depth analysis detailing your home's value as well as a comparison with similar homes in the area
Home Values in the Area
Average Home Value in this Area
Purchase History
| Date | Buyer | Sale Price | Title Company |
|---|---|---|---|
| James T T | -- | None Available | |
| James T T | -- | None Available | |
| Conway James T | -- | -- |
Source: Public Records
Mortgage History
| Date | Status | Borrower | Loan Amount |
|---|---|---|---|
| Previous Owner | Conway James T | $18,300 | |
| Previous Owner | Conway James T | $10,000 | |
| Previous Owner | Conway James T | $55,000 |
Source: Public Records
Tax History
| Year | Tax Paid | Tax Assessment Tax Assessment Total Assessment is a certain percentage of the fair market value that is determined by local assessors to be the total taxable value of land and additions on the property. | Land | Improvement |
|---|---|---|---|---|
| 2025 | $3,872 | $315,600 | $127,100 | $188,500 |
| 2024 | $3,771 | $315,600 | $127,100 | $188,500 |
| 2023 | $3,667 | $315,600 | $127,100 | $188,500 |
| 2022 | $3,421 | $228,200 | $88,900 | $139,300 |
| 2021 | $3,364 | $228,200 | $88,900 | $139,300 |
| 2020 | $3,268 | $228,200 | $88,900 | $139,300 |
| 2019 | $3,146 | $198,100 | $74,200 | $123,900 |
| 2018 | $3,055 | $198,100 | $74,200 | $123,900 |
| 2017 | $3,013 | $198,100 | $74,200 | $123,900 |
| 2016 | $2,637 | $154,400 | $65,800 | $88,600 |
| 2015 | $2,637 | $154,400 | $65,800 | $88,600 |
| 2014 | $1,941 | $154,400 | $65,800 | $88,600 |
| 2013 | $2,799 | $177,400 | $67,700 | $109,700 |
Source: Public Records
Map
Nearby Homes
- 15 E Earle St
- 134 Dexter St
- 23 Hewes St
- 50 Blackstone St
- 36 Dexter St
- 33 Kent St
- 28 Crowell St
- 26 Hopkins Terrace
- 27 Norman St
- 18 Cumberland St
- 789 High St
- 500 Mendon Rd Unit 257
- 519 Mendon Rd Unit 519
- 517 Mendon Rd Unit 517
- 47 Castle Rd
- 513 Mendon Rd Unit 513
- 515 Mendon Rd Unit 515
- 117 John St Unit 1
- 8 Dorr St
- 511 Mendon Rd Unit 511
Your Personal Tour Guide
Ask me questions while you tour the home.