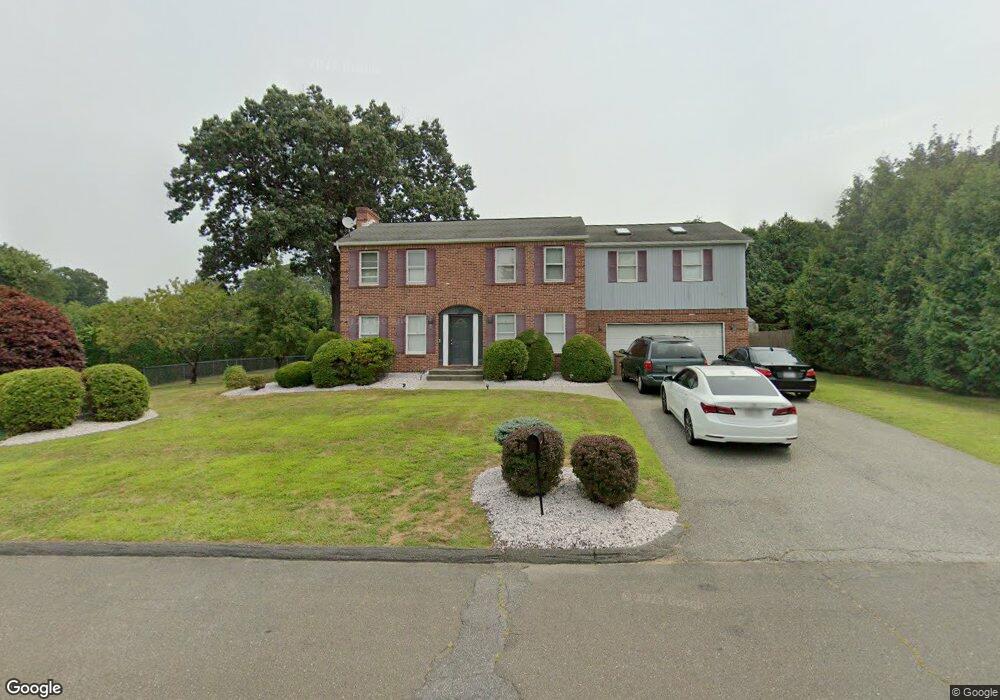
22 Erin Ln Ludlow, MA 01056
Estimated Value: $443,462 - $538,000
4
Beds
2
Baths
2,064
Sq Ft
$238/Sq Ft
Est. Value
About This Home
This home is located at 22 Erin Ln, Ludlow, MA 01056 and is currently estimated at $491,116, approximately $237 per square foot. 22 Erin Ln is a home located in Hampden County with nearby schools including East Street Elementary School, Chapin Street Elementary School, and Paul R. Baird Middle School.
Ownership History
Date
Name
Owned For
Owner Type
Purchase Details
Closed on
May 7, 2003
Sold by
Anastasia Jarry T and Anastasia Jarry
Bought by
Bryant Charlene J and Bryant Steven E
Current Estimated Value
Home Financials for this Owner
Home Financials are based on the most recent Mortgage that was taken out on this home.
Original Mortgage
$164,400
Outstanding Balance
$71,558
Interest Rate
5.93%
Mortgage Type
Purchase Money Mortgage
Estimated Equity
$419,558
Purchase Details
Closed on
Jun 29, 1992
Sold by
Sady Stephen M and Sady Diane M
Bought by
Anastasia Jarry T 5
Create a Home Valuation Report for This Property
The Home Valuation Report is an in-depth analysis detailing your home's value as well as a comparison with similar homes in the area
Home Values in the Area
Average Home Value in this Area
Purchase History
| Date | Buyer | Sale Price | Title Company |
|---|---|---|---|
| Bryant Charlene J | -- | -- | |
| Bryant Charlene J | -- | -- | |
| Bryant Charlene J | -- | -- | |
| Anastasia Jarry T 5 | $165,000 | -- | |
| Anastasia Jarry T | $165,000 | -- |
Source: Public Records
Mortgage History
| Date | Status | Borrower | Loan Amount |
|---|---|---|---|
| Open | Bryant Charlene J | $164,400 | |
| Closed | Anastasia Jarry T | $164,400 |
Source: Public Records
Tax History Compared to Growth
Tax History
| Year | Tax Paid | Tax Assessment Tax Assessment Total Assessment is a certain percentage of the fair market value that is determined by local assessors to be the total taxable value of land and additions on the property. | Land | Improvement |
|---|---|---|---|---|
| 2025 | $6,293 | $362,700 | $89,600 | $273,100 |
| 2024 | $6,062 | $335,100 | $89,400 | $245,700 |
| 2023 | $5,992 | $307,100 | $81,800 | $225,300 |
| 2022 | $5,723 | $286,300 | $85,200 | $201,100 |
| 2021 | $5,761 | $273,300 | $85,200 | $188,100 |
| 2020 | $5,518 | $267,600 | $83,900 | $183,700 |
| 2019 | $5,236 | $264,200 | $83,100 | $181,100 |
| 2018 | $4,891 | $257,300 | $83,100 | $174,200 |
| 2017 | $4,766 | $257,200 | $82,500 | $174,700 |
| 2016 | $4,795 | $264,500 | $87,800 | $176,700 |
| 2015 | $4,533 | $262,200 | $86,900 | $175,300 |
Source: Public Records
Map
Nearby Homes
- 33 Grimard St
- 166-168 Main St
- 201 Main St
- 42 Roy St
- 1200 Worcester St
- 298 Main St
- 3 Fontaine St
- 295 Main St
- 61 Massachusetts Ave
- 58 Mariana Ln
- 251 West St
- 0 Fuller St Unit 73409741
- 96 Lyons St
- 41 Deroche Cir
- 70 Fuller St
- 84 Fuller St Unit 1
- 98 Fuller St Unit 32
- 189 Essex St Unit H
- 20 Connolly St
- 34-36 Mazarin St