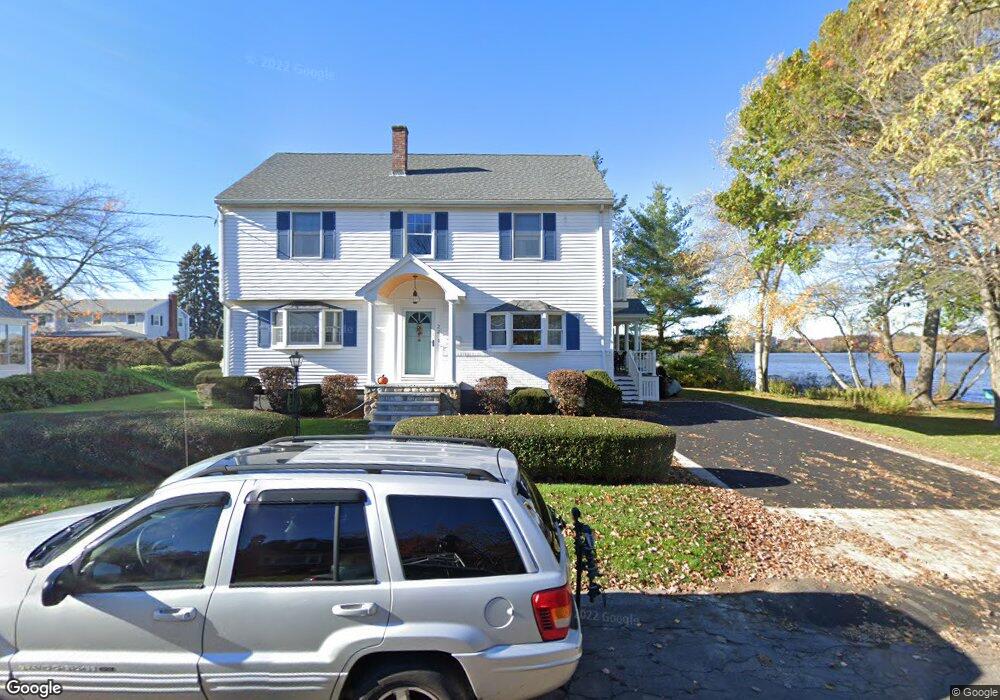
22 Fielding St Wakefield, MA 01880
West Side NeighborhoodEstimated Value: $821,000 - $968,000
3
Beds
2
Baths
2,072
Sq Ft
$436/Sq Ft
Est. Value
About This Home
This home is located at 22 Fielding St, Wakefield, MA 01880 and is currently estimated at $902,740, approximately $435 per square foot. 22 Fielding St is a home located in Middlesex County with nearby schools including Wakefield Memorial High School and St Joseph School.
Ownership History
Date
Name
Owned For
Owner Type
Purchase Details
Closed on
Sep 15, 1994
Sold by
Crowe Barbara A and Scannell Helen E
Bought by
Boudreau Michael and Boudreau Marueen E
Current Estimated Value
Home Financials for this Owner
Home Financials are based on the most recent Mortgage that was taken out on this home.
Original Mortgage
$126,000
Interest Rate
8.38%
Mortgage Type
Purchase Money Mortgage
Create a Home Valuation Report for This Property
The Home Valuation Report is an in-depth analysis detailing your home's value as well as a comparison with similar homes in the area
Home Values in the Area
Average Home Value in this Area
Purchase History
| Date | Buyer | Sale Price | Title Company |
|---|---|---|---|
| Boudreau Michael | $186,000 | -- |
Source: Public Records
Mortgage History
| Date | Status | Borrower | Loan Amount |
|---|---|---|---|
| Open | Boudreau Michael | $127,000 | |
| Closed | Boudreau Michael | $17,000 | |
| Closed | Boudreau Michael | $126,000 |
Source: Public Records
Tax History
| Year | Tax Paid | Tax Assessment Tax Assessment Total Assessment is a certain percentage of the fair market value that is determined by local assessors to be the total taxable value of land and additions on the property. | Land | Improvement |
|---|---|---|---|---|
| 2025 | $9,791 | $862,600 | $410,300 | $452,300 |
| 2024 | $9,028 | $802,500 | $381,700 | $420,800 |
| 2023 | $8,785 | $748,900 | $356,200 | $392,700 |
| 2022 | $8,238 | $668,700 | $318,100 | $350,600 |
| 2021 | $8,073 | $634,200 | $290,800 | $343,400 |
| 2020 | $7,592 | $594,500 | $272,600 | $321,900 |
| 2019 | $7,121 | $555,000 | $254,500 | $300,500 |
| 2018 | $6,866 | $530,200 | $243,100 | $287,100 |
| 2017 | $6,456 | $495,500 | $227,200 | $268,300 |
| 2016 | $6,281 | $465,600 | $224,300 | $241,300 |
| 2015 | $5,864 | $435,000 | $209,600 | $225,400 |
| 2014 | $5,424 | $424,400 | $204,500 | $219,900 |
Source: Public Records
Map
Nearby Homes
- 50 Quannapowitt Pkwy
- 16 Beebe Ln
- 29 Cordis St
- 80 Redfield Rd
- 95 Prospect St
- 8 Parker Rd Unit 5
- 3 Carnation Cir Unit C
- 39 Cedar St
- 2 Summit Dr Unit 43
- 1 Summit Dr Unit 57
- 57 Wave Ave
- 403 Gazebo Cir
- 50 Tuttle St Unit 12
- 24 Smith Ave
- 48 Village St Unit 1001
- 241 Main St Unit C3
- 22 Indian Hill Rd
- 43-45 Crescent St
- 16 Pleasant St
- 67 Woodcrest Dr
Your Personal Tour Guide
Ask me questions while you tour the home.