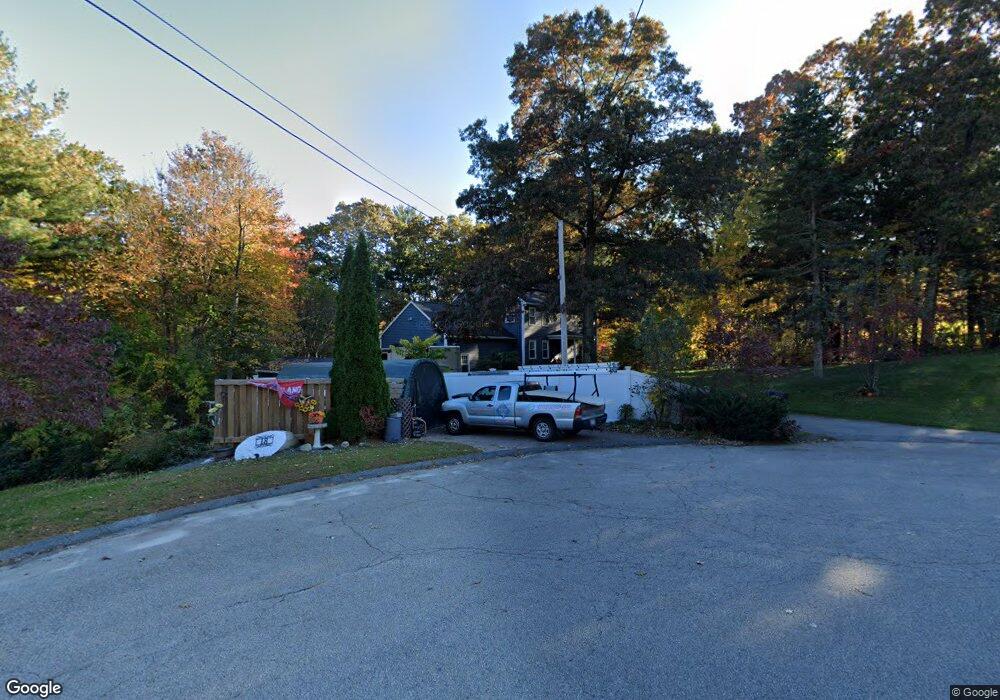
22 Flagg Dr Bellingham, MA 02019
Estimated Value: $659,000 - $808,000
4
Beds
3
Baths
2,342
Sq Ft
$305/Sq Ft
Est. Value
About This Home
This home is located at 22 Flagg Dr, Bellingham, MA 02019 and is currently estimated at $713,148, approximately $304 per square foot. 22 Flagg Dr is a home located in Norfolk County with nearby schools including Stall Brook Elementary School, Bellingham High School, and Bethany Christian Academy.
Ownership History
Date
Name
Owned For
Owner Type
Purchase Details
Closed on
Jul 19, 1996
Sold by
Roy Robert G Courchene and Roy Lisa T Courchene
Bought by
Maloney Michael T
Current Estimated Value
Purchase Details
Closed on
Dec 28, 1989
Sold by
Glover Tr Richard
Bought by
Courchene-Roy Robert
Purchase Details
Closed on
May 6, 1988
Sold by
Village Bldrs Const
Bought by
G & T Rlty Tr
Create a Home Valuation Report for This Property
The Home Valuation Report is an in-depth analysis detailing your home's value as well as a comparison with similar homes in the area
Home Values in the Area
Average Home Value in this Area
Purchase History
| Date | Buyer | Sale Price | Title Company |
|---|---|---|---|
| Maloney Michael T | $194,900 | -- | |
| Maloney Michael T | $194,900 | -- | |
| Courchene-Roy Robert | $187,900 | -- | |
| Courchene-Roy Robert | $187,900 | -- | |
| G & T Rlty Tr | $75,000 | -- |
Source: Public Records
Mortgage History
| Date | Status | Borrower | Loan Amount |
|---|---|---|---|
| Open | G & T Rlty Tr | $25,000 | |
| Open | G & T Rlty Tr | $180,000 |
Source: Public Records
Tax History Compared to Growth
Tax History
| Year | Tax Paid | Tax Assessment Tax Assessment Total Assessment is a certain percentage of the fair market value that is determined by local assessors to be the total taxable value of land and additions on the property. | Land | Improvement |
|---|---|---|---|---|
| 2025 | $7,304 | $581,500 | $175,700 | $405,800 |
| 2024 | $6,980 | $542,800 | $160,400 | $382,400 |
| 2023 | $6,729 | $515,600 | $152,800 | $362,800 |
| 2022 | $6,639 | $471,500 | $130,200 | $341,300 |
| 2021 | $6,408 | $444,700 | $130,200 | $314,500 |
| 2020 | $6,052 | $425,600 | $130,200 | $295,400 |
| 2019 | $5,928 | $417,200 | $130,200 | $287,000 |
| 2018 | $5,618 | $389,900 | $126,700 | $263,200 |
| 2017 | $5,454 | $380,300 | $126,700 | $253,600 |
| 2016 | $5,347 | $374,200 | $135,400 | $238,800 |
| 2015 | $5,137 | $360,500 | $130,200 | $230,300 |
| 2014 | $5,141 | $350,700 | $127,600 | $223,100 |
Source: Public Records
Map
Nearby Homes
- 1136 S Main St
- 7 Debra Ln
- 1099 S Main St
- 125 Blackstone St
- 501 Old Bridge Ln Unit 501
- 1501 Old Bridge Ln Unit 1501
- 1303 Old Bridge Ln Unit 1303
- 11 Silver Ave
- 123-125 Mendon St
- 975 S Main St
- 46 Douglas Dr
- 19 Geordan Ave
- 89 Lakeview Ave
- 49 Horseshoe Dr
- 108 N Main St
- 1 Clover Dr
- 0 North St Unit 73440626
- 26 Iris Ln
- 0 Prospect St
- 17 Susan Ln