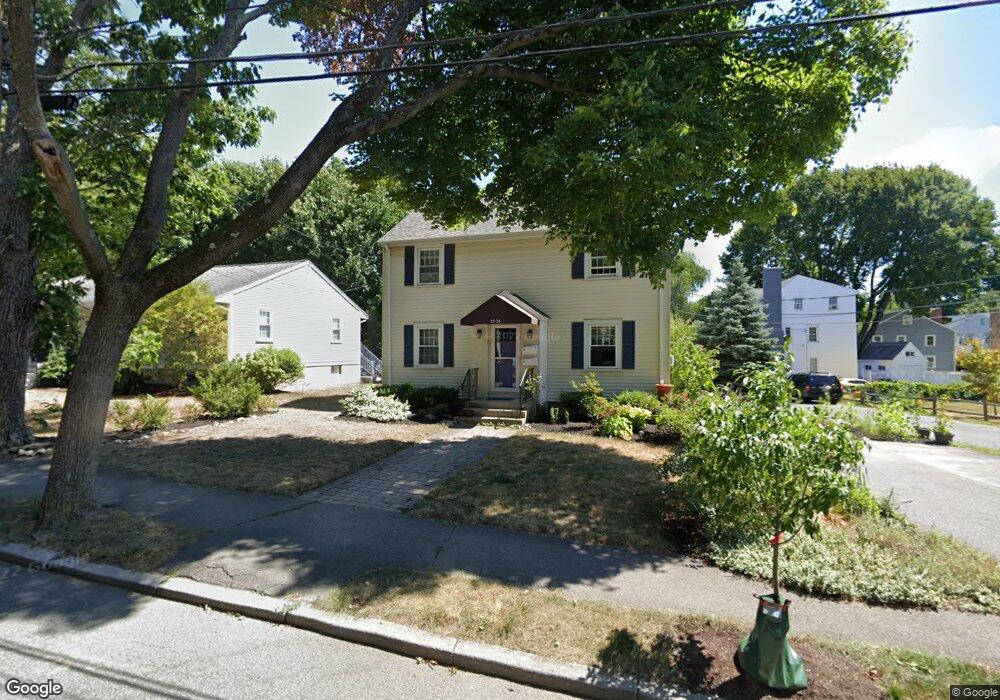
22 Fuller Terrace Unit 24 West Newton, MA 02465
West Newton NeighborhoodEstimated Value: $1,028,000 - $1,176,009
4
Beds
2
Baths
1,580
Sq Ft
$708/Sq Ft
Est. Value
About This Home
This home is located at 22 Fuller Terrace Unit 24, West Newton, MA 02465 and is currently estimated at $1,118,502, approximately $707 per square foot. 22 Fuller Terrace Unit 24 is a home located in Middlesex County with nearby schools including Franklin Elementary School, F.A. Day Middle School, and Newton North High School.
Ownership History
Date
Name
Owned For
Owner Type
Purchase Details
Closed on
Jul 12, 2018
Sold by
Barkley Mary P
Bought by
Mary P Barkley Ret
Current Estimated Value
Purchase Details
Closed on
Dec 17, 2007
Sold by
Mccann Ann E and Mccann Joseph C
Bought by
Barkley Mary P
Home Financials for this Owner
Home Financials are based on the most recent Mortgage that was taken out on this home.
Original Mortgage
$408,000
Interest Rate
6.3%
Mortgage Type
Purchase Money Mortgage
Purchase Details
Closed on
Jun 29, 2000
Sold by
Est Zilinskis Sylvia H and Zilinskis Alfred J
Bought by
Mccann Joseph C and Mccann Ann E
Home Financials for this Owner
Home Financials are based on the most recent Mortgage that was taken out on this home.
Original Mortgage
$365,750
Interest Rate
8.59%
Mortgage Type
Purchase Money Mortgage
Create a Home Valuation Report for This Property
The Home Valuation Report is an in-depth analysis detailing your home's value as well as a comparison with similar homes in the area
Home Values in the Area
Average Home Value in this Area
Purchase History
| Date | Buyer | Sale Price | Title Company |
|---|---|---|---|
| Mary P Barkley Ret | -- | -- | |
| Barkley Mary P | $510,000 | -- | |
| Mccann Joseph C | $385,000 | -- |
Source: Public Records
Mortgage History
| Date | Status | Borrower | Loan Amount |
|---|---|---|---|
| Previous Owner | Mccann Joseph C | $310,000 | |
| Previous Owner | Barkley Mary P | $408,000 | |
| Previous Owner | Mccann Joseph C | $365,750 | |
| Previous Owner | Mccann Joseph C | $5,406 |
Source: Public Records
Tax History Compared to Growth
Tax History
| Year | Tax Paid | Tax Assessment Tax Assessment Total Assessment is a certain percentage of the fair market value that is determined by local assessors to be the total taxable value of land and additions on the property. | Land | Improvement |
|---|---|---|---|---|
| 2025 | $8,245 | $841,300 | $759,900 | $81,400 |
| 2024 | $7,972 | $816,800 | $737,800 | $79,000 |
| 2023 | $7,599 | $746,500 | $595,400 | $151,100 |
| 2022 | $7,271 | $691,200 | $551,300 | $139,900 |
| 2021 | $6,823 | $634,100 | $505,800 | $128,300 |
| 2020 | $6,620 | $634,100 | $505,800 | $128,300 |
| 2019 | $6,193 | $592,600 | $472,700 | $119,900 |
| 2018 | $6,114 | $565,100 | $445,600 | $119,500 |
| 2017 | $5,765 | $518,400 | $408,800 | $109,600 |
| 2016 | $5,412 | $475,600 | $375,000 | $100,600 |
| 2015 | $5,161 | $444,500 | $350,500 | $94,000 |
Source: Public Records
Map
Nearby Homes
- 76 Harding St
- 76 Taft Ave Unit 1
- 76 Taft Ave
- 76 Taft Ave Unit 2
- 75 Cherry St
- 33 Joseph Rd
- 41 Kilburn Rd
- 287 Cherry St Unit 2
- 162 Myrtle St Unit 1
- 1 Farwell Cir
- 138 Myrtle St Unit 2
- 321 Albemarle Rd
- 56 Dearborn St
- 24 Tolman St Unit A
- 44 Westland Ave
- 39 Clinton St Unit 2
- 39 Clinton St Unit 1
- 11 Randlett Park
- 308 Newton St Unit 1
- 312 Newton St Unit 1A
- 22-24 Fuller Terrace
- 22-24 Fuller Terrace Unit 2
- 16 Fuller Terrace
- 32 Fuller Terrace Unit 2
- 32 Fuller Terrace
- 26 Fuller Terrace
- 30 Fuller Terrace Unit 32
- 28 Fuller Terrace
- 28 Fuller Terrace Unit 2
- 23 Fuller Terrace
- 19 Fuller Terrace
- 27 Fuller Terrace
- 183 Waltham St Unit 185
- 183 Waltham St Unit 183
- 34 Hatfield Rd Unit 36
- 38 Fuller Terrace Unit 38
- 13 Fuller Terrace
- 36 Fuller Terrace Unit 38
- 36 Fuller Terrace Unit 1
- 189-191 Waltham St Unit 2