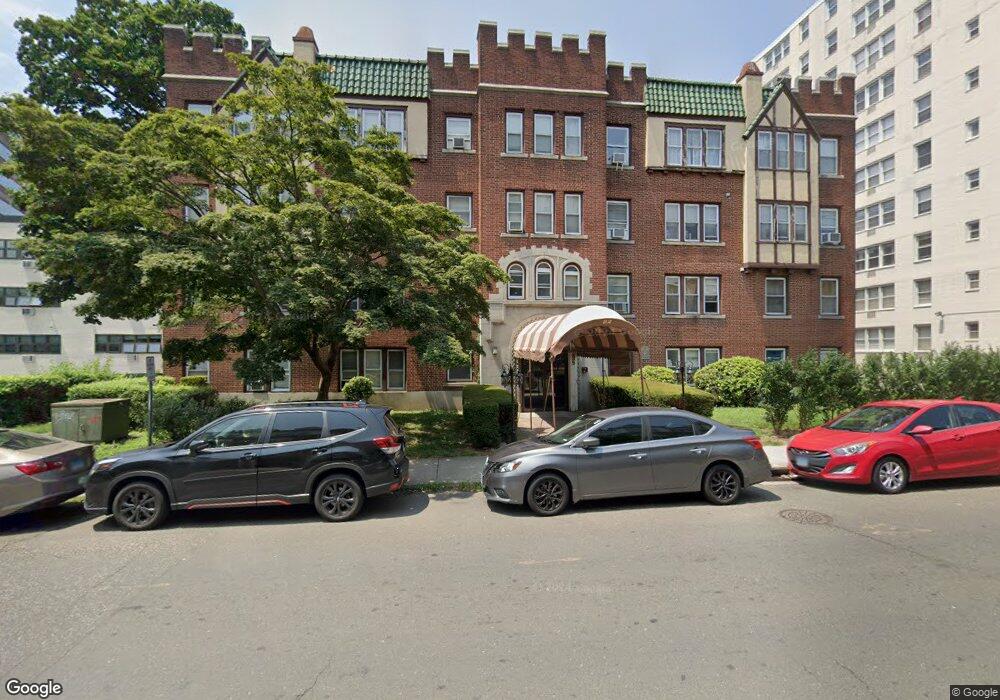
Glenbrook Road Condominiums 22 Glenbrook Rd Unit 313 Stamford, CT 06902
Downtown Stamford NeighborhoodEstimated Value: $152,000 - $305,000
1
Bed
1
Bath
530
Sq Ft
$400/Sq Ft
Est. Value
About This Home
This home is located at 22 Glenbrook Rd Unit 313, Stamford, CT 06902 and is currently estimated at $211,784, approximately $399 per square foot. 22 Glenbrook Rd Unit 313 is a home located in Fairfield County with nearby schools including Stillmeadow Elementary School, Rippowam Middle School, and Stamford High School.
Ownership History
Date
Name
Owned For
Owner Type
Purchase Details
Closed on
Dec 7, 2016
Sold by
Polyak Svetlana and Shenderov Yuri
Bought by
22 Glenbrook Road Assn
Current Estimated Value
Purchase Details
Closed on
Aug 23, 2011
Sold by
Bank Of New York
Bought by
Shenderov Yuri
Purchase Details
Closed on
Nov 22, 2010
Sold by
Aucay Luis I
Bought by
Bank Of New York
Purchase Details
Closed on
Feb 21, 2007
Sold by
Gonzalez Luz A
Bought by
Aucay Luis L
Home Financials for this Owner
Home Financials are based on the most recent Mortgage that was taken out on this home.
Original Mortgage
$140,080
Interest Rate
6.23%
Purchase Details
Closed on
Oct 26, 2001
Sold by
Molina Benjamin
Bought by
Gonzalez Luz Angela
Purchase Details
Closed on
Oct 21, 1998
Sold by
Zea Alice
Bought by
Molina Benjamin
Create a Home Valuation Report for This Property
The Home Valuation Report is an in-depth analysis detailing your home's value as well as a comparison with similar homes in the area
Home Values in the Area
Average Home Value in this Area
Purchase History
| Date | Buyer | Sale Price | Title Company |
|---|---|---|---|
| 22 Glenbrook Road Assn | $131,000 | -- | |
| Shenderov Yuri | $80,000 | -- | |
| Bank Of New York | -- | -- | |
| Aucay Luis L | $175,100 | -- | |
| Gonzalez Luz Angela | $45,000 | -- | |
| Molina Benjamin | $42,000 | -- |
Source: Public Records
Mortgage History
| Date | Status | Borrower | Loan Amount |
|---|---|---|---|
| Previous Owner | Molina Benjamin | $140,080 | |
| Previous Owner | Molina Benjamin | $26,265 |
Source: Public Records
Tax History Compared to Growth
Tax History
| Year | Tax Paid | Tax Assessment Tax Assessment Total Assessment is a certain percentage of the fair market value that is determined by local assessors to be the total taxable value of land and additions on the property. | Land | Improvement |
|---|---|---|---|---|
| 2025 | $2,006 | $83,880 | $0 | $83,880 |
| 2024 | $1,959 | $83,880 | $0 | $83,880 |
| 2023 | $2,117 | $83,880 | $0 | $83,880 |
| 2022 | $2,382 | $87,680 | $0 | $87,680 |
| 2021 | $2,362 | $87,680 | $0 | $87,680 |
| 2020 | $2,310 | $87,680 | $0 | $87,680 |
| 2019 | $2,310 | $87,680 | $0 | $87,680 |
| 2018 | $2,238 | $87,680 | $0 | $87,680 |
| 2017 | $2,025 | $75,310 | $0 | $75,310 |
| 2016 | $1,967 | $75,310 | $0 | $75,310 |
| 2015 | $1,915 | $75,310 | $0 | $75,310 |
| 2014 | $1,867 | $75,310 | $0 | $75,310 |
Source: Public Records
About Glenbrook Road Condominiums
Map
Nearby Homes
- 22 Glenbrook Rd Unit 414
- 50 Glenbrook Rd Unit 4B
- 50 Glenbrook Rd Unit 9F
- 50 Glenbrook Rd Unit 4B
- 71 Lindale St
- 300 Broad St Unit 902
- 49 Glenbrook Rd Unit 108
- 77 Lindale St
- 109 Highland Rd
- 49 Valley Rd
- 87 Glenbrook Rd Unit 3D
- 87 Glenbrook Rd Unit 3D
- 850 E Main St Unit 322
- 18 Highland Rd
- 5 Hundley Ct Unit 1-E
- 160 Glenbrook Rd Unit 4D
- 160 Glenbrook Rd Unit 3D
- 125 Prospect St Unit 2E
- 140 Grove St Unit 5F
- 180 Glenbrook Rd Unit 35
- 22 Glenbrook Rd Unit 416
- 22 Glenbrook Rd Unit 415
- 22 Glenbrook Rd Unit 413
- 22 Glenbrook Rd Unit 412
- 22 Glenbrook Rd Unit 411
- 22 Glenbrook Rd Unit 410
- 22 Glenbrook Rd Unit 409
- 22 Glenbrook Rd Unit 408
- 22 Glenbrook Rd Unit 407
- 22 Glenbrook Rd Unit 406
- 22 Glenbrook Rd Unit 405
- 22 Glenbrook Rd Unit 404
- 22 Glenbrook Rd Unit 403
- 22 Glenbrook Rd Unit 402
- 22 Glenbrook Rd Unit 401
- 22 Glenbrook Rd Unit 316
- 22 Glenbrook Rd Unit 315
- 22 Glenbrook Rd Unit 314
- 22 Glenbrook Rd Unit 312
- 22 Glenbrook Rd Unit 311