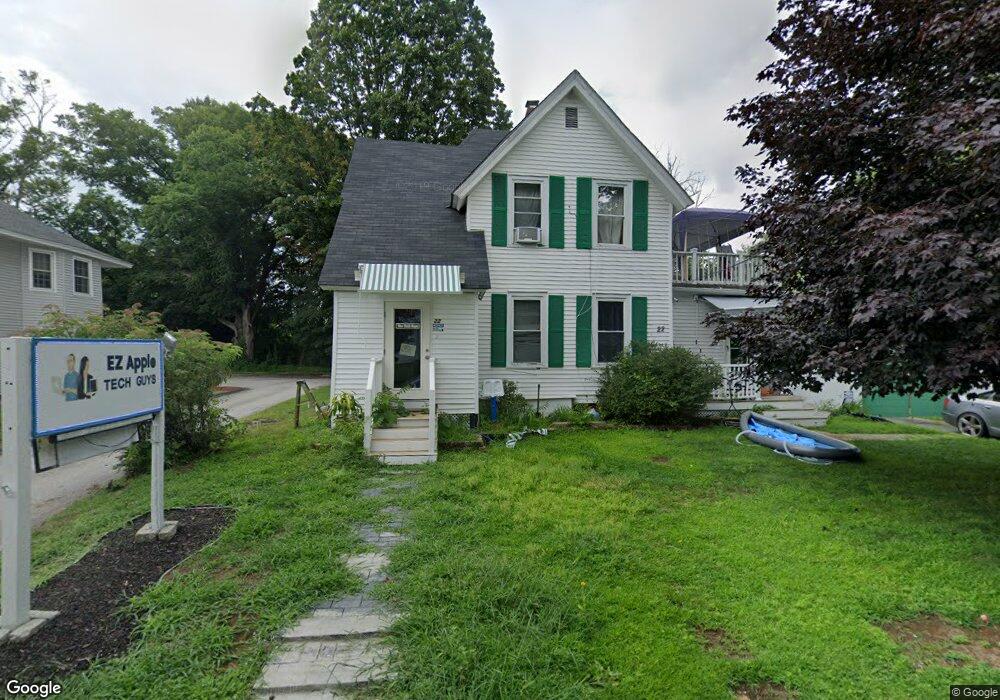
22 Hammond St Concord, NH 03301
South End NeighborhoodEstimated Value: $402,939
3
Beds
2
Baths
1,458
Sq Ft
$276/Sq Ft
Est. Value
About This Home
This home is located at 22 Hammond St, Concord, NH 03301 and is currently estimated at $402,939, approximately $276 per square foot. 22 Hammond St is a home located in Merrimack County with nearby schools including Abbot-Downing School, Rundlett Middle School, and Concord High School.
Ownership History
Date
Name
Owned For
Owner Type
Purchase Details
Closed on
Nov 19, 2021
Sold by
Clarissa Shaira and Perkins Kyle
Bought by
Perkins Kyle and Perkins Scott
Current Estimated Value
Home Financials for this Owner
Home Financials are based on the most recent Mortgage that was taken out on this home.
Original Mortgage
$240,000
Outstanding Balance
$220,223
Interest Rate
3.09%
Mortgage Type
Stand Alone Refi Refinance Of Original Loan
Estimated Equity
$182,716
Purchase Details
Closed on
Sep 5, 2013
Sold by
Kesavan Saroja
Bought by
Perkins Kyle
Create a Home Valuation Report for This Property
The Home Valuation Report is an in-depth analysis detailing your home's value as well as a comparison with similar homes in the area
Home Values in the Area
Average Home Value in this Area
Purchase History
| Date | Buyer | Sale Price | Title Company |
|---|---|---|---|
| Perkins Kyle | -- | None Available | |
| Perkins Kyle | -- | None Available | |
| Perkins Kyle | -- | None Available | |
| Perkins Kyle | $197,000 | -- | |
| Perkins Kyle | $197,000 | -- |
Source: Public Records
Mortgage History
| Date | Status | Borrower | Loan Amount |
|---|---|---|---|
| Open | Perkins Kyle | $240,000 | |
| Closed | Perkins Kyle | $240,000 |
Source: Public Records
Tax History Compared to Growth
Tax History
| Year | Tax Paid | Tax Assessment Tax Assessment Total Assessment is a certain percentage of the fair market value that is determined by local assessors to be the total taxable value of land and additions on the property. | Land | Improvement |
|---|---|---|---|---|
| 2024 | $3,708 | $133,900 | $51,100 | $82,800 |
| 2023 | $3,597 | $133,900 | $51,100 | $82,800 |
| 2022 | $3,467 | $133,900 | $51,100 | $82,800 |
| 2021 | $3,364 | $133,900 | $51,100 | $82,800 |
| 2020 | $3,556 | $132,900 | $53,500 | $79,400 |
| 2019 | $3,359 | $120,900 | $53,500 | $67,400 |
| 2018 | $3,298 | $117,000 | $53,500 | $63,500 |
| 2017 | $3,197 | $113,200 | $53,500 | $59,700 |
| 2016 | $3,030 | $109,500 | $53,500 | $56,000 |
| 2015 | $2,961 | $108,300 | $53,500 | $54,800 |
| 2014 | $2,904 | $108,300 | $53,500 | $54,800 |
| 2013 | $2,758 | $107,800 | $53,500 | $54,300 |
| 2012 | $2,688 | $110,300 | $53,500 | $56,800 |
Source: Public Records
Map
Nearby Homes
- 105 S Main St
- 24 Badger St
- 33 Spruce St
- 0 Spruce St Unit 88
- 14 Downing St
- 41 Longmeadow Dr
- 22 Longmeadow Dr
- 10 Perley St
- 14-16 Perley St
- 75 S State St
- 87 S Main St Unit 2
- 69 Manchester St Unit Lot 18
- 122 South St
- 376 S Main St
- 12 Avon St
- 47 South St
- 0 South St Unit 4969509
- 9 Strawberry Ln
- 15 Bridle Path Trail
- 4 Fayette St