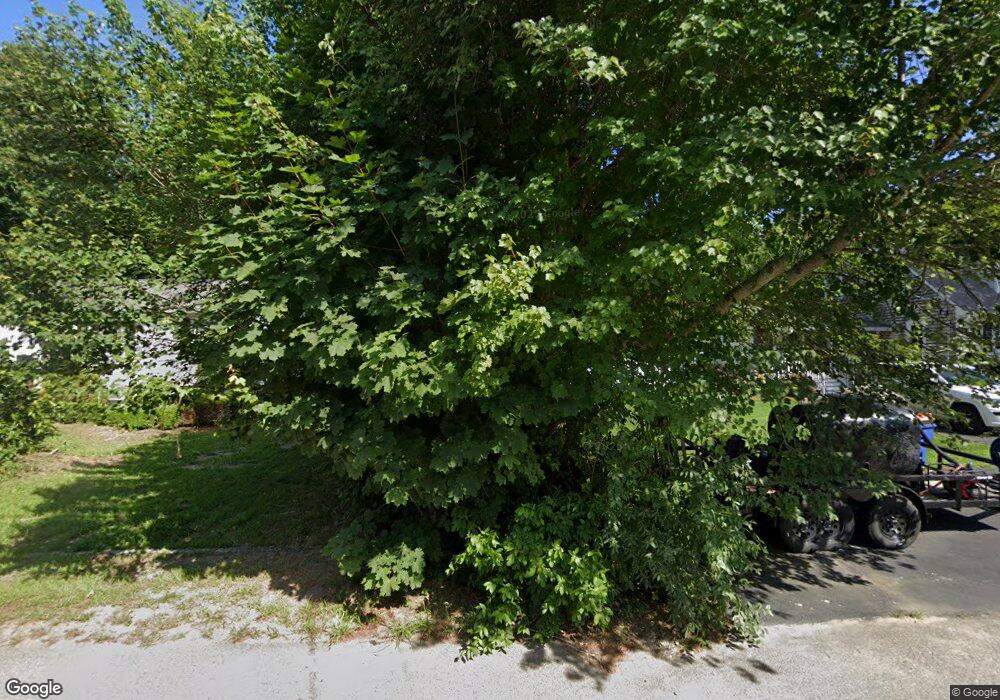
22 Helen St West Wareham, MA 02576
Estimated Value: $549,000 - $591,000
4
Beds
2
Baths
1,705
Sq Ft
$334/Sq Ft
Est. Value
About This Home
This home is located at 22 Helen St, West Wareham, MA 02576 and is currently estimated at $570,286, approximately $334 per square foot. 22 Helen St is a home located in Plymouth County.
Ownership History
Date
Name
Owned For
Owner Type
Purchase Details
Closed on
Nov 15, 2023
Sold by
Hogan Christopher J and Hogan Janet L
Bought by
Jc Rt and Hogan
Current Estimated Value
Purchase Details
Closed on
Dec 12, 1990
Sold by
Linn Steven D
Bought by
Hogan Christopher J
Create a Home Valuation Report for This Property
The Home Valuation Report is an in-depth analysis detailing your home's value as well as a comparison with similar homes in the area
Home Values in the Area
Average Home Value in this Area
Purchase History
| Date | Buyer | Sale Price | Title Company |
|---|---|---|---|
| Jc Rt | -- | None Available | |
| Jc Rt | -- | None Available | |
| Hogan Christopher J | $145,000 | -- | |
| Hogan Christopher J | $145,000 | -- |
Source: Public Records
Mortgage History
| Date | Status | Borrower | Loan Amount |
|---|---|---|---|
| Previous Owner | Hogan Christopher J | $30,000 | |
| Previous Owner | Hogan Christopher J | $100,000 | |
| Previous Owner | Hogan Christopher J | $25,000 |
Source: Public Records
Tax History Compared to Growth
Tax History
| Year | Tax Paid | Tax Assessment Tax Assessment Total Assessment is a certain percentage of the fair market value that is determined by local assessors to be the total taxable value of land and additions on the property. | Land | Improvement |
|---|---|---|---|---|
| 2025 | $4,781 | $458,800 | $127,300 | $331,500 |
| 2024 | $4,772 | $424,900 | $102,100 | $322,800 |
| 2023 | $4,235 | $377,200 | $92,900 | $284,300 |
| 2022 | $4,235 | $321,300 | $92,900 | $228,400 |
| 2021 | $4,167 | $309,800 | $92,900 | $216,900 |
| 2020 | $3,904 | $294,400 | $92,900 | $201,500 |
| 2019 | $3,897 | $293,200 | $98,200 | $195,000 |
| 2018 | $3,720 | $272,900 | $98,200 | $174,700 |
| 2017 | $3,514 | $261,300 | $98,200 | $163,100 |
| 2016 | $3,286 | $242,900 | $103,000 | $139,900 |
| 2015 | $3,175 | $242,900 | $103,000 | $139,900 |
| 2014 | $3,144 | $244,700 | $98,000 | $146,700 |
Source: Public Records
Map
Nearby Homes