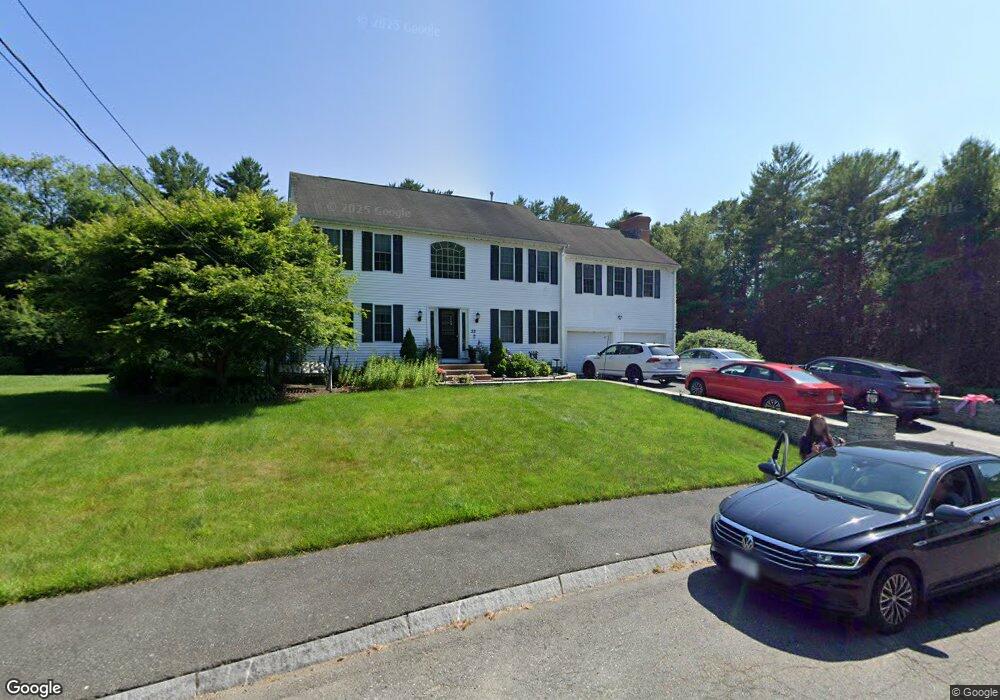
22 Henry Rd Taunton, MA 02780
Prospect Hill NeighborhoodEstimated Value: $651,000 - $716,000
3
Beds
3
Baths
2,448
Sq Ft
$280/Sq Ft
Est. Value
About This Home
This home is located at 22 Henry Rd, Taunton, MA 02780 and is currently estimated at $686,054, approximately $280 per square foot. 22 Henry Rd is a home located in Bristol County with nearby schools including Benjamin Friedman Middle School, Joseph C. Chamberlain Elementary School, and Taunton High School.
Ownership History
Date
Name
Owned For
Owner Type
Purchase Details
Closed on
May 4, 2023
Sold by
Falco Michael J
Bought by
Michael Falco Lt
Current Estimated Value
Purchase Details
Closed on
May 30, 2014
Sold by
Falco Michael J and Falco Dainne
Bought by
Falco Michael J
Purchase Details
Closed on
Oct 18, 2010
Sold by
Falco Michael J
Bought by
Falco Michael J and Falco Dianne
Home Financials for this Owner
Home Financials are based on the most recent Mortgage that was taken out on this home.
Original Mortgage
$258,750
Interest Rate
4.36%
Mortgage Type
Purchase Money Mortgage
Create a Home Valuation Report for This Property
The Home Valuation Report is an in-depth analysis detailing your home's value as well as a comparison with similar homes in the area
Home Values in the Area
Average Home Value in this Area
Purchase History
| Date | Buyer | Sale Price | Title Company |
|---|---|---|---|
| Michael Falco Lt | -- | None Available | |
| Falco Michael J | -- | -- | |
| Falco Michael J | -- | -- |
Source: Public Records
Mortgage History
| Date | Status | Borrower | Loan Amount |
|---|---|---|---|
| Previous Owner | Falco Michael J | $258,750 |
Source: Public Records
Tax History Compared to Growth
Tax History
| Year | Tax Paid | Tax Assessment Tax Assessment Total Assessment is a certain percentage of the fair market value that is determined by local assessors to be the total taxable value of land and additions on the property. | Land | Improvement |
|---|---|---|---|---|
| 2025 | $6,133 | $560,600 | $147,100 | $413,500 |
| 2024 | $5,770 | $515,600 | $147,100 | $368,500 |
| 2023 | $5,650 | $468,900 | $140,500 | $328,400 |
| 2022 | $5,526 | $419,300 | $128,400 | $290,900 |
| 2021 | $5,400 | $380,300 | $116,900 | $263,400 |
| 2020 | $4,133 | $350,200 | $116,900 | $233,300 |
| 2019 | $5,496 | $348,700 | $122,700 | $226,000 |
| 2018 | $3,424 | $339,700 | $123,800 | $215,900 |
| 2017 | $5,123 | $326,100 | $118,100 | $208,000 |
| 2016 | $4,974 | $317,200 | $114,500 | $202,700 |
| 2015 | $4,727 | $314,900 | $114,500 | $200,400 |
| 2014 | $4,703 | $321,900 | $114,500 | $207,400 |
Source: Public Records
Map
Nearby Homes