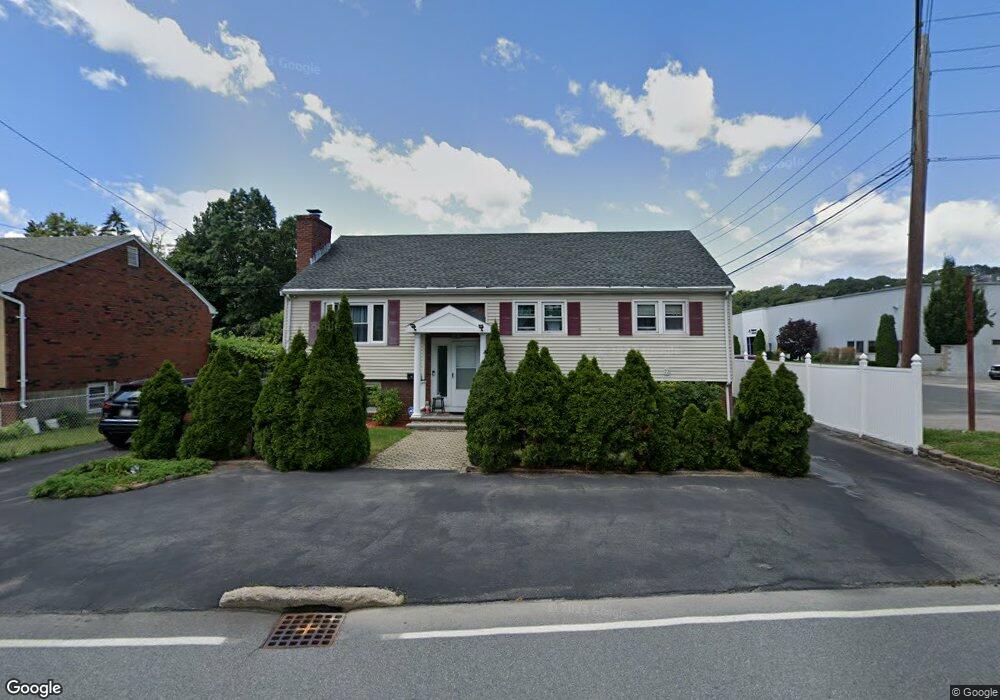
22 Holton St Winchester, MA 01890
Estimated Value: $972,936 - $1,090,000
5
Beds
2
Baths
1,935
Sq Ft
$523/Sq Ft
Est. Value
About This Home
This home is located at 22 Holton St, Winchester, MA 01890 and is currently estimated at $1,011,984, approximately $522 per square foot. 22 Holton St is a home located in Middlesex County with nearby schools including Lynch Elementary School, McCall Middle School, and Winchester High School.
Ownership History
Date
Name
Owned For
Owner Type
Purchase Details
Closed on
Sep 16, 2009
Sold by
Callen James M and Callen Mary A
Bought by
Yu Man P and Yu Simone M
Current Estimated Value
Home Financials for this Owner
Home Financials are based on the most recent Mortgage that was taken out on this home.
Original Mortgage
$328,000
Interest Rate
5.28%
Mortgage Type
Purchase Money Mortgage
Purchase Details
Closed on
Jan 31, 1997
Sold by
Fnma
Bought by
Callen James N
Purchase Details
Closed on
Jul 2, 1996
Sold by
Clark Richard D and Clark Joyce J
Bought by
Federal National Mortgage Association
Purchase Details
Closed on
Nov 4, 1988
Sold by
Bolduc Robert F
Bought by
Clark Richard D
Create a Home Valuation Report for This Property
The Home Valuation Report is an in-depth analysis detailing your home's value as well as a comparison with similar homes in the area
Home Values in the Area
Average Home Value in this Area
Purchase History
| Date | Buyer | Sale Price | Title Company |
|---|---|---|---|
| Yu Man P | $410,000 | -- | |
| Callen James N | $180,000 | -- | |
| Federal National Mortgage Association | $184,500 | -- | |
| Clark Richard D | $179,000 | -- |
Source: Public Records
Mortgage History
| Date | Status | Borrower | Loan Amount |
|---|---|---|---|
| Open | Clark Richard D | $326,000 | |
| Closed | Yu Man P | $328,000 | |
| Previous Owner | Clark Richard D | $255,000 |
Source: Public Records
Tax History Compared to Growth
Tax History
| Year | Tax Paid | Tax Assessment Tax Assessment Total Assessment is a certain percentage of the fair market value that is determined by local assessors to be the total taxable value of land and additions on the property. | Land | Improvement |
|---|---|---|---|---|
| 2025 | $91 | $817,500 | $489,600 | $327,900 |
| 2024 | $9,237 | $815,300 | $489,600 | $325,700 |
| 2023 | $8,397 | $711,600 | $428,400 | $283,200 |
| 2022 | $8,219 | $657,000 | $367,200 | $289,800 |
| 2021 | $8,134 | $634,000 | $344,200 | $289,800 |
| 2020 | $7,855 | $634,000 | $344,200 | $289,800 |
| 2019 | $6,520 | $538,400 | $248,600 | $289,800 |
| 2018 | $4,483 | $528,600 | $242,500 | $286,100 |
| 2017 | $6,343 | $516,500 | $242,500 | $274,000 |
| 2016 | $6,033 | $516,500 | $242,500 | $274,000 |
| 2015 | $5,793 | $477,200 | $220,300 | $256,900 |
| 2014 | $5,502 | $434,600 | $183,600 | $251,000 |
Source: Public Records
Map
Nearby Homes
- 2 George Rd Unit 2
- 95 Irving St
- 171 Swanton St Unit 73
- 571 Washington St
- 29 Shepard Ct
- 20 Arthur St
- 61 Mount Pleasant St
- 14 Cross St
- 237 Swanton St
- 18 Raymond Place
- 200 Swanton St Unit 228
- 200 Swanton St Unit 636
- 200 Swanton St Unit 234
- 200 Swanton St Unit T28
- 69 Eastern Ave
- 4 Laurel St
- 14 Grant Rd
- 3 Laurel St
- 39 Garfield Ave
- 3 Frank St