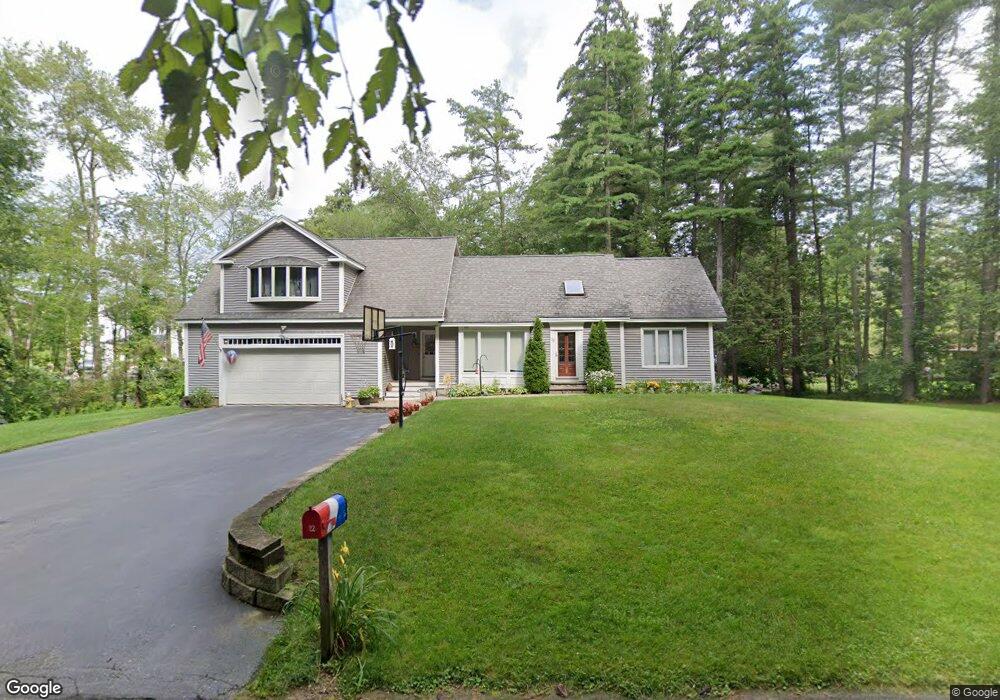
22 Horseshoe Rd Windham, NH 03087
Estimated Value: $709,748 - $780,000
3
Beds
2
Baths
2,352
Sq Ft
$315/Sq Ft
Est. Value
About This Home
This home is located at 22 Horseshoe Rd, Windham, NH 03087 and is currently estimated at $741,187, approximately $315 per square foot. 22 Horseshoe Rd is a home located in Rockingham County with nearby schools including Golden Brook Elementary School, Windham Middle School, and Windham High School.
Ownership History
Date
Name
Owned For
Owner Type
Purchase Details
Closed on
Jan 13, 2020
Sold by
Suliveras Adam
Bought by
Suliveras Adam and Suliveras Melanie
Current Estimated Value
Home Financials for this Owner
Home Financials are based on the most recent Mortgage that was taken out on this home.
Original Mortgage
$373,000
Outstanding Balance
$327,585
Interest Rate
3.73%
Mortgage Type
New Conventional
Estimated Equity
$413,602
Purchase Details
Closed on
Oct 9, 2014
Sold by
Suliveras Gina L
Bought by
Suliveras Adam
Home Financials for this Owner
Home Financials are based on the most recent Mortgage that was taken out on this home.
Original Mortgage
$263,900
Interest Rate
4.1%
Mortgage Type
New Conventional
Purchase Details
Closed on
Jun 15, 2004
Sold by
H & B Homes Corp
Bought by
Sarcia Domenic W and Sarcia Katherine M
Purchase Details
Closed on
Apr 26, 2002
Sold by
Caron Roland J
Bought by
Carangelo Gina L
Create a Home Valuation Report for This Property
The Home Valuation Report is an in-depth analysis detailing your home's value as well as a comparison with similar homes in the area
Home Values in the Area
Average Home Value in this Area
Purchase History
| Date | Buyer | Sale Price | Title Company |
|---|---|---|---|
| Suliveras Adam | -- | None Available | |
| Suliveras Adam | -- | -- | |
| Suliveras Adam | -- | -- | |
| Sarcia Domenic W | $261,400 | -- | |
| Carangelo Gina L | $225,000 | -- |
Source: Public Records
Mortgage History
| Date | Status | Borrower | Loan Amount |
|---|---|---|---|
| Open | Suliveras Adam | $373,000 | |
| Previous Owner | Suliveras Adam | $263,900 | |
| Previous Owner | Carangelo Gina L | $228,000 | |
| Previous Owner | Carangelo Gina L | $230,000 |
Source: Public Records
Tax History
| Year | Tax Paid | Tax Assessment Tax Assessment Total Assessment is a certain percentage of the fair market value that is determined by local assessors to be the total taxable value of land and additions on the property. | Land | Improvement |
|---|---|---|---|---|
| 2024 | $9,203 | $406,500 | $152,600 | $253,900 |
| 2023 | $8,699 | $406,500 | $152,600 | $253,900 |
| 2022 | $8,032 | $406,500 | $152,600 | $253,900 |
| 2021 | $7,536 | $404,700 | $152,600 | $252,100 |
| 2020 | $7,742 | $404,700 | $152,600 | $252,100 |
| 2019 | $7,067 | $313,400 | $129,100 | $184,300 |
| 2018 | $6,149 | $313,400 | $129,100 | $184,300 |
| 2017 | $6,331 | $313,400 | $129,100 | $184,300 |
| 2016 | $6,838 | $313,400 | $129,100 | $184,300 |
| 2015 | $6,807 | $313,400 | $129,100 | $184,300 |
| 2014 | $7,370 | $307,100 | $152,000 | $155,100 |
| 2013 | $7,203 | $305,200 | $152,000 | $153,200 |
Source: Public Records
Map
Nearby Homes
- 6 Chadwick Cir
- 54 Enterprise Dr
- 5 Johnson St
- 4 Arbor Rd
- 16 Arbor Rd
- 98 Trails Edge Rd
- 47 Cobbetts Pond Rd
- 108 S Shore Rd
- 48 Marblehead Rd
- 39 Overton Rd
- 14 Londonderry Rd
- 144 N Policy St
- 10 Harris Rd
- 6-18 Mary Anthony Dr
- 7 Lilac Ridge Rd
- 106 N Lowell Rd
- 11 Sullivan Ct
- 24 Rockingham Rd
- 47 Campbell St
- 30 Main St
Your Personal Tour Guide
Ask me questions while you tour the home.