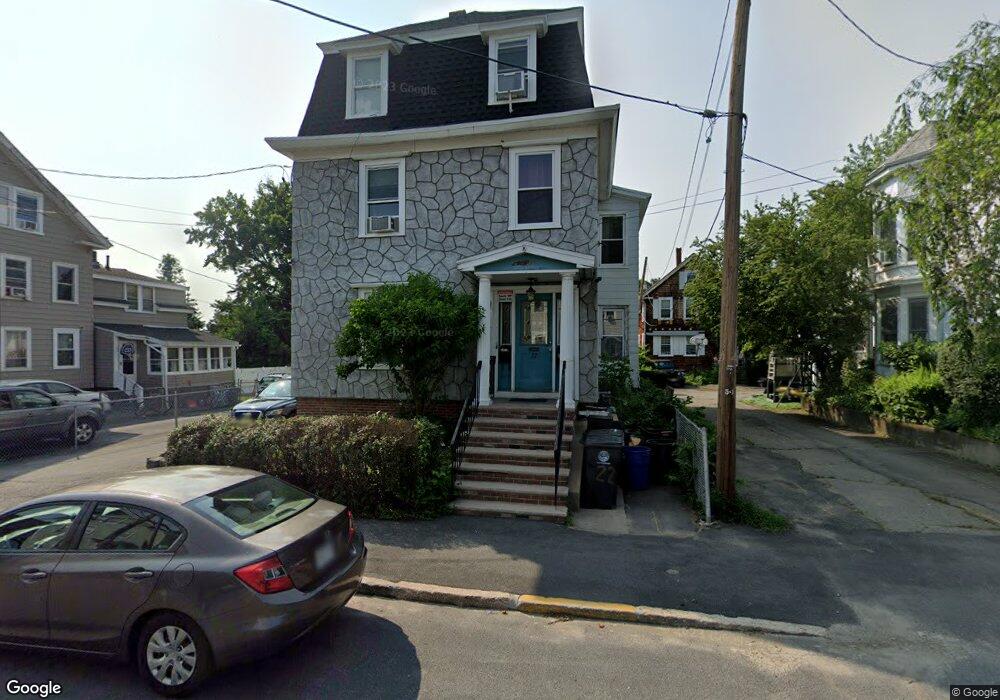
22 Howard St Unit 2 Haverhill, MA 01830
Walnut Square NeighborhoodEstimated Value: $616,000 - $892,000
4
Beds
1
Bath
1,300
Sq Ft
$571/Sq Ft
Est. Value
About This Home
This home is located at 22 Howard St Unit 2, Haverhill, MA 01830 and is currently estimated at $741,919, approximately $570 per square foot. 22 Howard St Unit 2 is a home located in Essex County with nearby schools including Dr. Paul Nettle Middle School.
Ownership History
Date
Name
Owned For
Owner Type
Purchase Details
Closed on
Aug 30, 2013
Sold by
22 Howard St Haverhl I
Bought by
Garcia Francine A
Current Estimated Value
Home Financials for this Owner
Home Financials are based on the most recent Mortgage that was taken out on this home.
Original Mortgage
$6,494
Outstanding Balance
$4,856
Interest Rate
4.53%
Estimated Equity
$737,063
Purchase Details
Closed on
Mar 5, 2013
Sold by
Burgett Lisa K
Bought by
22 Howard Street Irt
Purchase Details
Closed on
Jul 13, 2012
Sold by
Martin Patricia S
Bought by
Burgett Lisa K
Purchase Details
Closed on
Feb 19, 1987
Sold by
Noukas James J
Bought by
Bourque Francis G
Create a Home Valuation Report for This Property
The Home Valuation Report is an in-depth analysis detailing your home's value as well as a comparison with similar homes in the area
Home Values in the Area
Average Home Value in this Area
Purchase History
| Date | Buyer | Sale Price | Title Company |
|---|---|---|---|
| Garcia Francine A | $239,000 | -- | |
| 22 Howard Street Irt | -- | -- | |
| Burgett Lisa K | $185,000 | -- | |
| Bourque Francis G | $123,500 | -- |
Source: Public Records
Mortgage History
| Date | Status | Borrower | Loan Amount |
|---|---|---|---|
| Open | Bourque Francis G | $6,494 | |
| Open | Bourque Francis G | $184,030 |
Source: Public Records
Tax History Compared to Growth
Tax History
| Year | Tax Paid | Tax Assessment Tax Assessment Total Assessment is a certain percentage of the fair market value that is determined by local assessors to be the total taxable value of land and additions on the property. | Land | Improvement |
|---|---|---|---|---|
| 2025 | $6,600 | $616,200 | $141,900 | $474,300 |
| 2024 | $5,907 | $555,200 | $140,400 | $414,800 |
| 2023 | $5,584 | $500,800 | $128,400 | $372,400 |
| 2022 | $5,317 | $418,000 | $116,500 | $301,500 |
| 2021 | $4,989 | $371,200 | $101,500 | $269,700 |
| 2020 | $4,746 | $349,000 | $94,100 | $254,900 |
| 2019 | $4,405 | $315,800 | $82,100 | $233,700 |
| 2018 | $4,198 | $294,400 | $77,700 | $216,700 |
| 2017 | $3,554 | $237,100 | $62,700 | $174,400 |
| 2016 | $3,639 | $236,900 | $62,700 | $174,200 |
| 2015 | $3,375 | $219,900 | $62,700 | $157,200 |
Source: Public Records
Map
Nearby Homes
- 16 Fountain St
- 16 Dudley St
- 81-83 Kenoza Ave
- 20 Ashland St
- 25-27 Dover St
- 100 Lawrence St Unit 5
- 34 7th Ave
- 23 Arlington St
- 13-15 Arlington St
- 17 Arlington St
- 7 Clinton St Unit 4
- 33 Hamilton Ave
- 6 Dexter St
- 48 Portland St
- 151 Franklin St
- 192 Franklin St
- 27 Webster St
- 8 Bartlett Ave Unit 5
- 25 Portland St
- 70 Brockton Ave