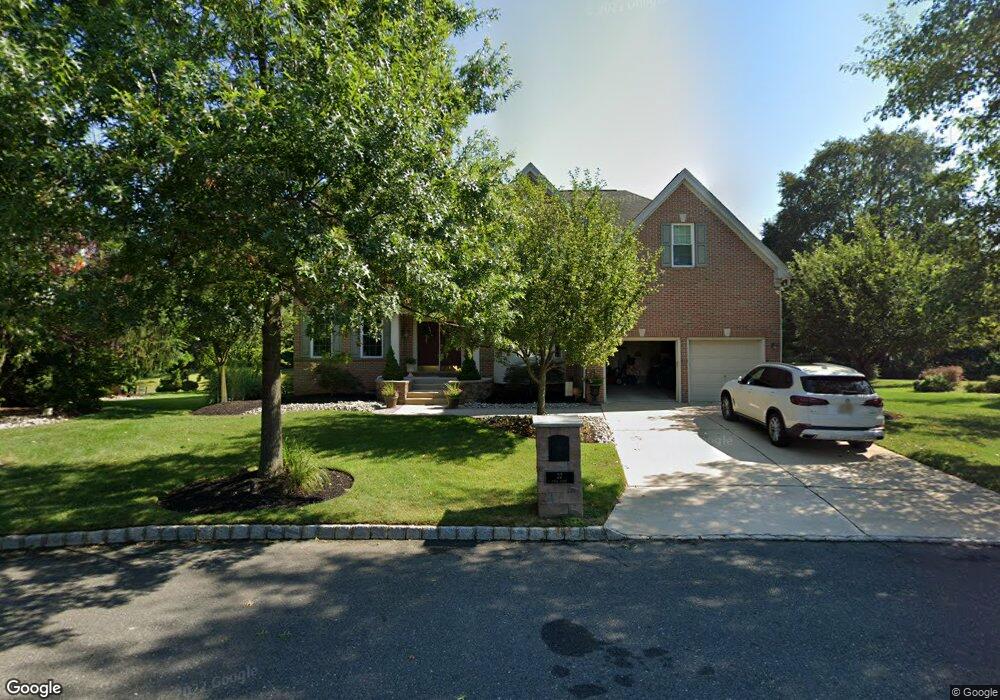
22 Kyle Ct Mount Laurel, NJ 08054
Estimated Value: $794,734 - $964,000
Studio
--
Bath
3,488
Sq Ft
$259/Sq Ft
Est. Value
About This Home
This home is located at 22 Kyle Ct, Mount Laurel, NJ 08054 and is currently estimated at $903,184, approximately $258 per square foot. 22 Kyle Ct is a home located in Burlington County with nearby schools including Hillside Elementary School, T.E. Harrington Middle School, and Mount Laurel Hartford School.
Ownership History
Date
Name
Owned For
Owner Type
Purchase Details
Closed on
Oct 27, 2014
Sold by
Adelman Adam J and Adelman Deborah A
Bought by
Adelmann Adam J and Adelmann Deborah A
Current Estimated Value
Home Financials for this Owner
Home Financials are based on the most recent Mortgage that was taken out on this home.
Original Mortgage
$417,000
Outstanding Balance
$316,940
Interest Rate
4.18%
Mortgage Type
New Conventional
Estimated Equity
$586,244
Purchase Details
Closed on
Sep 26, 2002
Sold by
Orleans Corp
Bought by
Adelman Adam J and Adelman Deborah A
Home Financials for this Owner
Home Financials are based on the most recent Mortgage that was taken out on this home.
Original Mortgage
$310,000
Interest Rate
6.27%
Create a Home Valuation Report for This Property
The Home Valuation Report is an in-depth analysis detailing your home's value as well as a comparison with similar homes in the area
Home Values in the Area
Average Home Value in this Area
Purchase History
| Date | Buyer | Sale Price | Title Company |
|---|---|---|---|
| Adelmann Adam J | -- | Stewart Title Company | |
| Adelman Adam J | $410,990 | Surety Title Corporation |
Source: Public Records
Mortgage History
| Date | Status | Borrower | Loan Amount |
|---|---|---|---|
| Open | Adelmann Adam J | $417,000 | |
| Closed | Adelman Adam J | $310,000 |
Source: Public Records
Tax History
| Year | Tax Paid | Tax Assessment Tax Assessment Total Assessment is a certain percentage of the fair market value that is determined by local assessors to be the total taxable value of land and additions on the property. | Land | Improvement |
|---|---|---|---|---|
| 2025 | $15,896 | $503,500 | $137,500 | $366,000 |
| 2024 | $15,296 | $503,500 | $137,500 | $366,000 |
| 2023 | $15,296 | $503,500 | $137,500 | $366,000 |
| 2022 | $15,246 | $503,500 | $137,500 | $366,000 |
| 2021 | $14,959 | $503,500 | $137,500 | $366,000 |
| 2020 | $14,667 | $503,500 | $137,500 | $366,000 |
| 2019 | $14,516 | $503,500 | $137,500 | $366,000 |
| 2018 | $14,405 | $503,500 | $137,500 | $366,000 |
| 2017 | $14,033 | $503,500 | $137,500 | $366,000 |
| 2016 | $13,695 | $498,900 | $137,500 | $361,400 |
| 2015 | $13,535 | $498,900 | $137,500 | $361,400 |
| 2014 | $13,400 | $498,900 | $137,500 | $361,400 |
Source: Public Records
Map
Nearby Homes
- 15 Richland Dr
- 2 Kyle Ct
- 20 Richland Dr
- 54 Rome Way
- 89 Hillside Ln
- 169A Bradford Ct
- 159A Bradford Ct Unit A
- 155A Bradford Ct Unit 155
- 0 Hartford Rd
- 42 Clifford Ct
- 16 Peppergrass Dr N
- 22 Peppergrass Dr N
- 0 Park Ln Unit NJBL2032016
- 24 Whitechapel Dr
- 2507A Shurlock Ct
- 505A Ralston Dr Unit A
- 505A Ralston Dr
- 2907A Tarnbrook Dr
- 7 Drake Ct
- 2407 Shurlock Ct
Your Personal Tour Guide
Ask me questions while you tour the home.