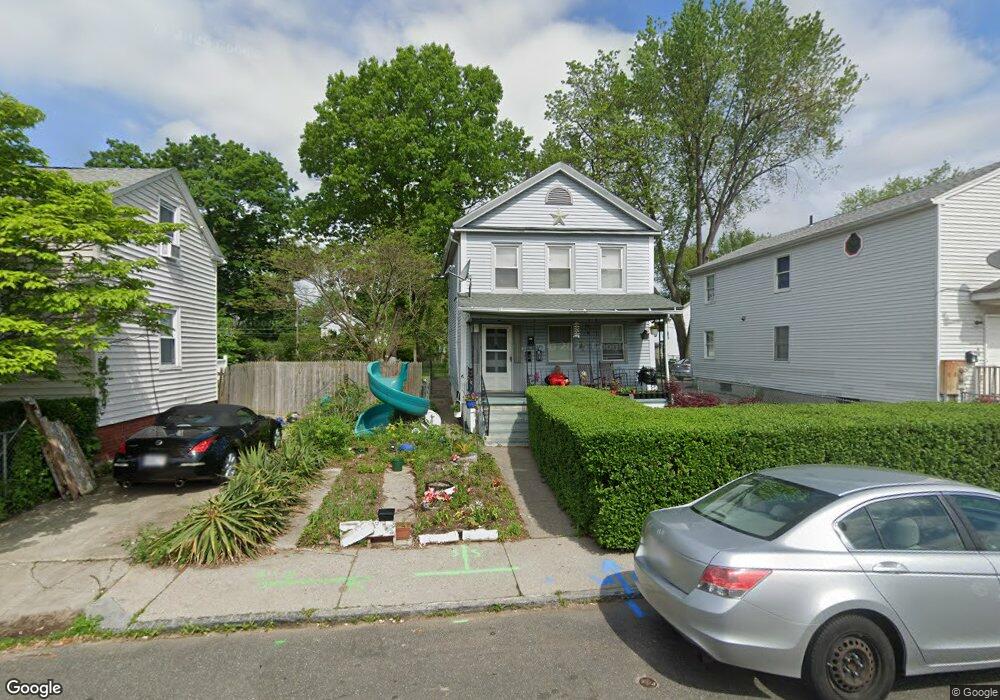
22 Lebanon St Springfield, MA 01109
Old Hill NeighborhoodEstimated Value: $227,000 - $281,000
4
Beds
1
Bath
1,712
Sq Ft
$153/Sq Ft
Est. Value
About This Home
This home is located at 22 Lebanon St, Springfield, MA 01109 and is currently estimated at $262,646, approximately $153 per square foot. 22 Lebanon St is a home located in Hampden County with nearby schools including Elias Brookings School, M Marcus Kiley Middle, and High School Of Commerce.
Ownership History
Date
Name
Owned For
Owner Type
Purchase Details
Closed on
Apr 29, 2005
Sold by
Hall A Chsristopher
Bought by
Diaz Alberto R
Current Estimated Value
Home Financials for this Owner
Home Financials are based on the most recent Mortgage that was taken out on this home.
Original Mortgage
$55,000
Outstanding Balance
$28,880
Interest Rate
5.95%
Mortgage Type
Purchase Money Mortgage
Estimated Equity
$233,766
Create a Home Valuation Report for This Property
The Home Valuation Report is an in-depth analysis detailing your home's value as well as a comparison with similar homes in the area
Home Values in the Area
Average Home Value in this Area
Purchase History
| Date | Buyer | Sale Price | Title Company |
|---|---|---|---|
| Diaz Alberto R | $70,000 | -- |
Source: Public Records
Mortgage History
| Date | Status | Borrower | Loan Amount |
|---|---|---|---|
| Open | Diaz Alberto R | $55,000 | |
| Closed | Diaz Alberto R | $15,000 |
Source: Public Records
Tax History Compared to Growth
Tax History
| Year | Tax Paid | Tax Assessment Tax Assessment Total Assessment is a certain percentage of the fair market value that is determined by local assessors to be the total taxable value of land and additions on the property. | Land | Improvement |
|---|---|---|---|---|
| 2025 | $2,509 | $160,000 | $26,100 | $133,900 |
| 2024 | $2,059 | $128,200 | $24,400 | $103,800 |
| 2023 | $2,075 | $121,700 | $23,200 | $98,500 |
| 2022 | $2,362 | $125,500 | $21,100 | $104,400 |
| 2021 | $2,355 | $124,600 | $19,200 | $105,400 |
| 2020 | $2,363 | $121,000 | $19,200 | $101,800 |
| 2019 | $2,120 | $107,700 | $19,200 | $88,500 |
| 2018 | $1,856 | $94,300 | $19,200 | $75,100 |
| 2017 | $1,872 | $95,200 | $15,400 | $79,800 |
| 2016 | $1,905 | $96,900 | $15,400 | $81,500 |
| 2015 | $1,878 | $95,500 | $15,400 | $80,100 |
Source: Public Records
Map
Nearby Homes