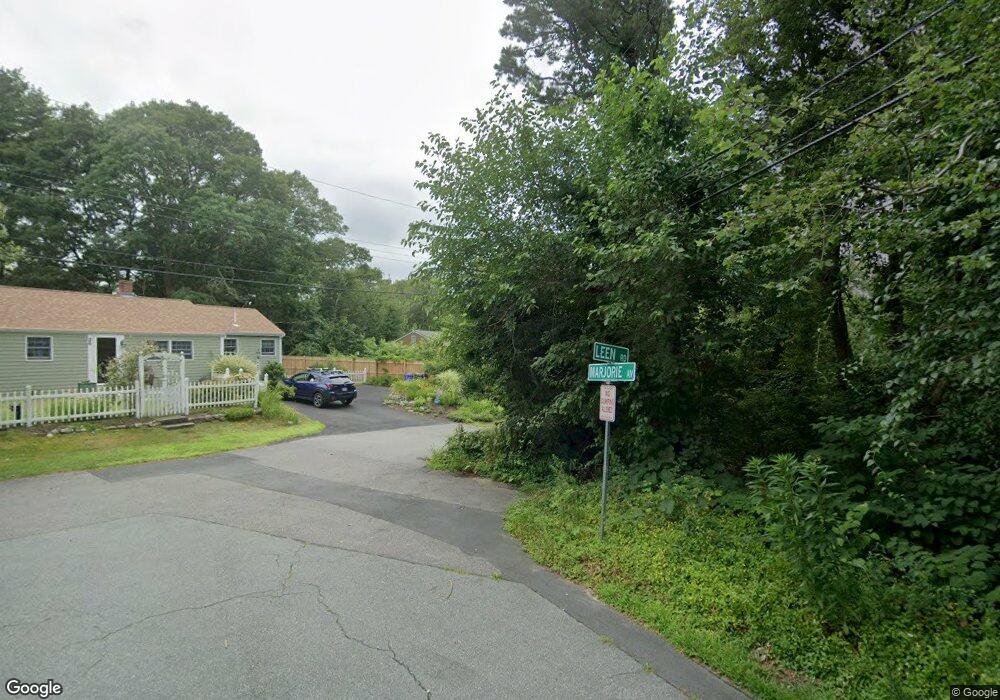
22 Leen Rd Pocasset, MA 02559
Pocasset NeighborhoodEstimated Value: $503,000 - $568,000
2
Beds
2
Baths
1,001
Sq Ft
$547/Sq Ft
Est. Value
About This Home
This home is located at 22 Leen Rd, Pocasset, MA 02559 and is currently estimated at $547,330, approximately $546 per square foot. 22 Leen Rd is a home located in Barnstable County with nearby schools including Bourne High School, Cadence Academy Preschool - Bourne, and St Margaret Regional School.
Ownership History
Date
Name
Owned For
Owner Type
Purchase Details
Closed on
Oct 30, 2003
Sold by
Willis Claire E
Bought by
Schenck Robert and Schenck Linda M
Current Estimated Value
Purchase Details
Closed on
Apr 6, 1998
Sold by
Graziano John J and Graziano Shirley F
Bought by
Willis Charles C and Willis Claire E
Purchase Details
Closed on
Sep 22, 1988
Sold by
Welch Joanne M
Bought by
Graziano Donna M
Home Financials for this Owner
Home Financials are based on the most recent Mortgage that was taken out on this home.
Original Mortgage
$104,550
Interest Rate
10.51%
Mortgage Type
Purchase Money Mortgage
Create a Home Valuation Report for This Property
The Home Valuation Report is an in-depth analysis detailing your home's value as well as a comparison with similar homes in the area
Home Values in the Area
Average Home Value in this Area
Purchase History
| Date | Buyer | Sale Price | Title Company |
|---|---|---|---|
| Schenck Robert | $198,000 | -- | |
| Schenck Robert | $198,000 | -- | |
| Willis Charles C | $115,000 | -- | |
| Willis Charles C | $115,000 | -- | |
| Graziano Donna M | $123,000 | -- |
Source: Public Records
Mortgage History
| Date | Status | Borrower | Loan Amount |
|---|---|---|---|
| Previous Owner | Graziano Donna M | $5,000 | |
| Previous Owner | Graziano Donna M | $104,550 |
Source: Public Records
Tax History Compared to Growth
Tax History
| Year | Tax Paid | Tax Assessment Tax Assessment Total Assessment is a certain percentage of the fair market value that is determined by local assessors to be the total taxable value of land and additions on the property. | Land | Improvement |
|---|---|---|---|---|
| 2025 | $3,516 | $450,200 | $215,900 | $234,300 |
| 2024 | $3,539 | $441,300 | $224,300 | $217,000 |
| 2023 | $3,440 | $390,500 | $198,500 | $192,000 |
| 2022 | $3,181 | $315,300 | $161,000 | $154,300 |
| 2021 | $3,091 | $287,000 | $146,500 | $140,500 |
| 2020 | $2,994 | $278,800 | $145,100 | $133,700 |
| 2019 | $2,851 | $271,300 | $145,100 | $126,200 |
| 2018 | $2,724 | $258,400 | $144,500 | $113,900 |
| 2017 | $2,651 | $257,400 | $143,200 | $114,200 |
| 2016 | $2,519 | $247,900 | $143,200 | $104,700 |
| 2015 | $2,057 | $204,300 | $99,600 | $104,700 |
Source: Public Records
Map
Nearby Homes
- 7 4th Ave
- 15 1st St
- 940 County Rd
- 174 Barlows Landing Rd
- 709 County Rd
- 940 County Rd
- 254 Barlows Landing Rd
- 7 Portside Dr
- 39 Bennets Neck Dr
- 171 Bellavista Dr
- 1094 County Rd
- 3 Red Brook Pond Dr
- 22 Nairn Rd
- 48 Red Brook Harbor Rd
- 14 Navajo Rd
- 34 Kenwood Rd
- 515 County Rd
- 70 Wings Neck Rd
- 45 Kenwood Rd