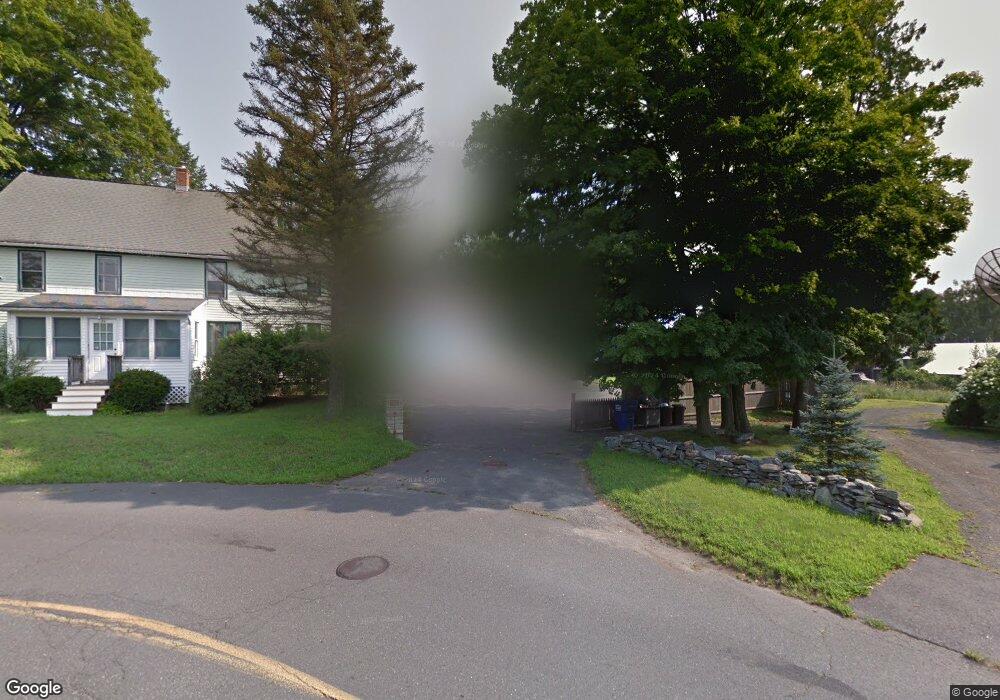
22 Lyman St Easthampton, MA 01027
Estimated Value: $431,000 - $518,039
4
Beds
4
Baths
2,709
Sq Ft
$177/Sq Ft
Est. Value
About This Home
This home is located at 22 Lyman St, Easthampton, MA 01027 and is currently estimated at $480,760, approximately $177 per square foot. 22 Lyman St is a home located in Hampshire County with nearby schools including Easthampton High School, Hilltown Cooperative Charter Public School, and Tri-County Schools.
Ownership History
Date
Name
Owned For
Owner Type
Purchase Details
Closed on
Sep 29, 2015
Sold by
Dearellano Gail and Talbot Janis A
Bought by
Mathiau Julia
Current Estimated Value
Home Financials for this Owner
Home Financials are based on the most recent Mortgage that was taken out on this home.
Original Mortgage
$140,000
Outstanding Balance
$108,362
Interest Rate
3.97%
Mortgage Type
New Conventional
Estimated Equity
$372,398
Purchase Details
Closed on
Oct 4, 2006
Sold by
Zawacki Walter
Bought by
Talbot Janis
Create a Home Valuation Report for This Property
The Home Valuation Report is an in-depth analysis detailing your home's value as well as a comparison with similar homes in the area
Home Values in the Area
Average Home Value in this Area
Purchase History
We collect this data history from publicly available records. To have your information removed, we recommend requesting removal directly through your county’s website.
| Date | Buyer | Sale Price | Title Company |
|---|---|---|---|
| Mathiau Julia | $175,000 | -- | |
| Talbot Janis | -- | -- | |
| Talbot Janis | -- | -- |
Source: Public Records
Mortgage History
We collect this data history from publicly available records. To have your information removed, we recommend requesting removal directly through your county’s website.
| Date | Status | Borrower | Loan Amount |
|---|---|---|---|
| Open | Mathiau Julia | $140,000 | |
| Previous Owner | Talbot Janis | $90,000 | |
| Previous Owner | Talbot Janis | $111,000 | |
| Previous Owner | Talbot Janis | $111,000 |
Source: Public Records
Tax History
| Year | Tax Paid | Tax Assessment Tax Assessment Total Assessment is a certain percentage of the fair market value that is determined by local assessors to be the total taxable value of land and additions on the property. | Land | Improvement |
|---|---|---|---|---|
| 2025 | $5,297 | $387,500 | $118,100 | $269,400 |
| 2024 | $5,113 | $377,100 | $114,700 | $262,400 |
| 2023 | $3,934 | $268,500 | $90,900 | $177,600 |
| 2022 | $4,438 | $268,500 | $90,900 | $177,600 |
| 2021 | $4,873 | $277,800 | $90,900 | $186,900 |
| 2020 | $4,769 | $268,500 | $90,900 | $177,600 |
| 2019 | $4,097 | $265,000 | $90,900 | $174,100 |
| 2018 | $3,960 | $247,500 | $85,700 | $161,800 |
| 2017 | $3,873 | $238,900 | $82,300 | $156,600 |
| 2016 | $3,724 | $238,900 | $82,300 | $156,600 |
| 2015 | $3,619 | $238,900 | $82,300 | $156,600 |
Source: Public Records
Map
Nearby Homes
- 296 Old Wilson Rd
- 44 Westhampton Rd
- 64-66 Pleasant St
- 74 Parsons St
- 635 Florence Rd
- 17 Adams St
- 20 Meadowbrook Dr
- 17 Olympia St
- 138 West St
- 26 Mount Tom Ave
- 85 Garfield Ave
- 27 Holyoke St
- M143 &152 Glendale St
- 283 South St
- 16 Steplar Crossing Unit 16
- 52-54 Holyoke St
- 194 Brookside Cir
- 336 Main St
- 179 South St
- 19 East St Unit A
Your Personal Tour Guide
Ask me questions while you tour the home.