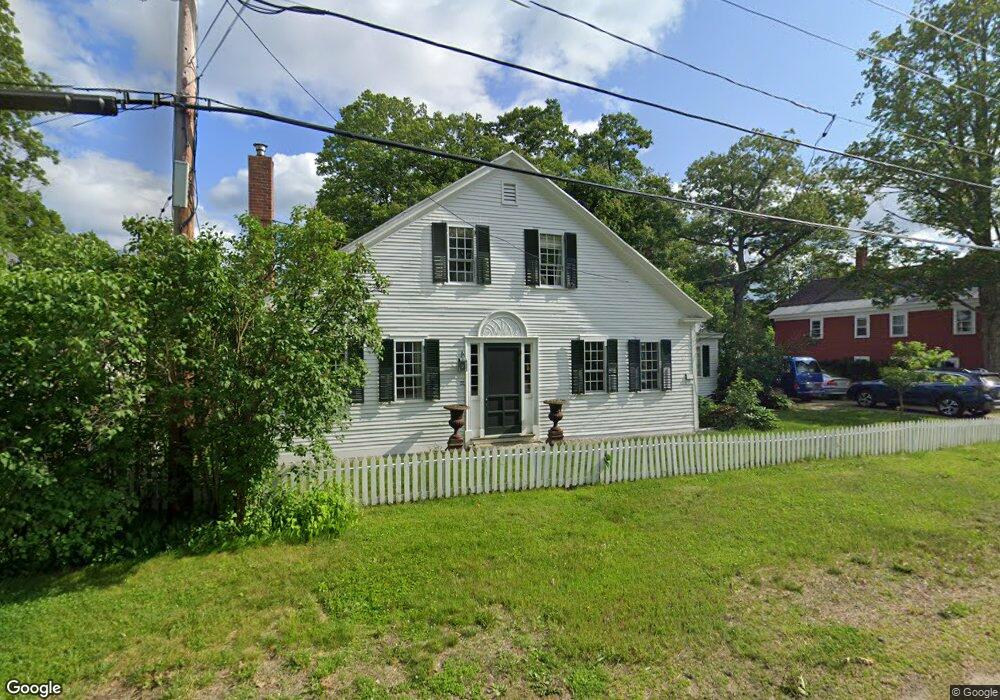
22 Main St Unit U04/69 Hancock, NH 03449
Estimated Value: $432,000 - $616,000
3
Beds
2
Baths
3,287
Sq Ft
$150/Sq Ft
Est. Value
About This Home
This home is located at 22 Main St Unit U04/69, Hancock, NH 03449 and is currently estimated at $494,070, approximately $150 per square foot. 22 Main St Unit U04/69 is a home located in Hillsborough County with nearby schools including Hancock Elementary School, Great Brook School, and Conval Regional High School.
Ownership History
Date
Name
Owned For
Owner Type
Purchase Details
Closed on
Feb 21, 2023
Sold by
Frame James H and Corr Kathleen L
Bought by
Frame & Corr Ft
Current Estimated Value
Purchase Details
Closed on
Sep 28, 2017
Sold by
Mullin Kathleen Est
Bought by
Frame James H and Corr Kathleen L
Create a Home Valuation Report for This Property
The Home Valuation Report is an in-depth analysis detailing your home's value as well as a comparison with similar homes in the area
Home Values in the Area
Average Home Value in this Area
Purchase History
| Date | Buyer | Sale Price | Title Company |
|---|---|---|---|
| Frame & Corr Ft | -- | None Available | |
| Frame & Corr Ft | -- | None Available | |
| Frame James H | $206,000 | -- |
Source: Public Records
Tax History Compared to Growth
Tax History
| Year | Tax Paid | Tax Assessment Tax Assessment Total Assessment is a certain percentage of the fair market value that is determined by local assessors to be the total taxable value of land and additions on the property. | Land | Improvement |
|---|---|---|---|---|
| 2024 | $6,998 | $278,700 | $96,400 | $182,300 |
| 2023 | $6,731 | $278,700 | $96,400 | $182,300 |
| 2022 | $6,078 | $278,700 | $96,400 | $182,300 |
| 2020 | $6,744 | $257,200 | $81,500 | $175,700 |
| 2019 | $5,788 | $235,300 | $81,500 | $153,800 |
| 2018 | $5,546 | $235,300 | $81,500 | $153,800 |
| 2016 | $5,438 | $235,300 | $81,500 | $153,800 |
| 2015 | $5,470 | $246,500 | $86,900 | $159,600 |
| 2014 | $5,522 | $246,500 | $86,900 | $159,600 |
| 2012 | $5,185 | $249,300 | $91,500 | $157,800 |
Source: Public Records
Map
Nearby Homes
- 38 Main St
- 00 Middle Rd
- 18 Antrim Rd
- 0 Cavender Rd Unit 5
- 27 Lee Farm Rd
- 100 Antrim Rd
- 7 Spring Hill Rd
- Lot R11-11-1 Forest Rd
- 166 Prospect Hill Rd
- 31 Moose Brook Ln
- 16 Bobalink Cir
- 38 Moose Brook Ln
- 123 Prospect Hill Rd
- 1388 Forest Rd
- 39 Lucy Ln
- 8 Lucy Ln
- 37 Lucy Ln
- 47 Lucy Ln
- 49 Lucy Ln
- 51 Lucy Ln