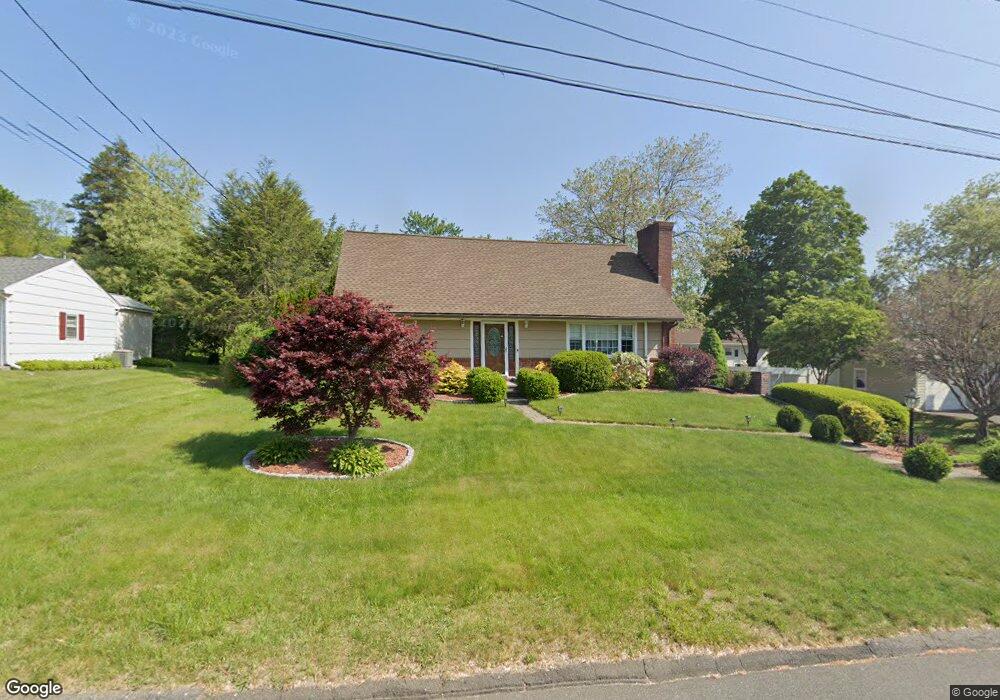
22 Maple St Trumbull, CT 06611
West Trumbull NeighborhoodEstimated Value: $565,000 - $652,015
3
Beds
3
Baths
1,927
Sq Ft
$327/Sq Ft
Est. Value
About This Home
This home is located at 22 Maple St, Trumbull, CT 06611 and is currently estimated at $629,504, approximately $326 per square foot. 22 Maple St is a home located in Fairfield County with nearby schools including Frenchtown Elementary School, Madison Middle School, and Trumbull High School.
Ownership History
Date
Name
Owned For
Owner Type
Purchase Details
Closed on
Dec 23, 2008
Sold by
Lasalle Bank Na
Bought by
Robinson Charles K and Jack-Robinson Ketechia K
Current Estimated Value
Home Financials for this Owner
Home Financials are based on the most recent Mortgage that was taken out on this home.
Original Mortgage
$309,320
Interest Rate
6.27%
Purchase Details
Closed on
Dec 26, 1995
Sold by
Piccirillo John
Bought by
Cioppa Ronald and Cioppa Katherine
Create a Home Valuation Report for This Property
The Home Valuation Report is an in-depth analysis detailing your home's value as well as a comparison with similar homes in the area
Home Values in the Area
Average Home Value in this Area
Purchase History
| Date | Buyer | Sale Price | Title Company |
|---|---|---|---|
| Robinson Charles K | $320,000 | -- | |
| Cioppa Ronald | $200,000 | -- |
Source: Public Records
Mortgage History
| Date | Status | Borrower | Loan Amount |
|---|---|---|---|
| Open | Cioppa Ronald | $309,825 | |
| Closed | Cioppa Ronald | $319,443 | |
| Closed | Cioppa Ronald | $309,320 |
Source: Public Records
Tax History Compared to Growth
Tax History
| Year | Tax Paid | Tax Assessment Tax Assessment Total Assessment is a certain percentage of the fair market value that is determined by local assessors to be the total taxable value of land and additions on the property. | Land | Improvement |
|---|---|---|---|---|
| 2025 | $10,631 | $289,310 | $139,230 | $150,080 |
| 2024 | $10,330 | $289,310 | $139,230 | $150,080 |
| 2023 | $10,165 | $289,310 | $139,230 | $150,080 |
| 2022 | $10,001 | $289,310 | $139,230 | $150,080 |
| 2021 | $8,496 | $233,660 | $113,960 | $119,700 |
| 2020 | $8,333 | $233,660 | $113,960 | $119,700 |
| 2018 | $8,147 | $233,660 | $113,960 | $119,700 |
| 2017 | $7,996 | $233,660 | $113,960 | $119,700 |
| 2016 | $7,790 | $233,660 | $113,960 | $119,700 |
| 2015 | $7,213 | $215,500 | $114,000 | $101,500 |
| 2014 | $7,060 | $215,500 | $114,000 | $101,500 |
Source: Public Records
Map
Nearby Homes
- lot 194 Prospect Ave
- 88 Chestnut Hill Rd
- 66 Loftus Cir
- 18 Ridgebury Dr
- 81 Lance Cir
- 121 Richfield Rd
- 8 Raleigh Rd
- 42 Wendy Rd
- 5763 Park Ave
- 40 Toll House Ln
- 26 Grove St
- 110 Minturn Rd
- 114 Minturn Place
- 132 Toll House Ln
- 252 Bear Paw Rd
- 394 Anton Dr
- 4487 Madison Ave
- 10 Aragon Dr
- 3370 Madison Ave Unit 10B
- 45 Frenchtown Rd