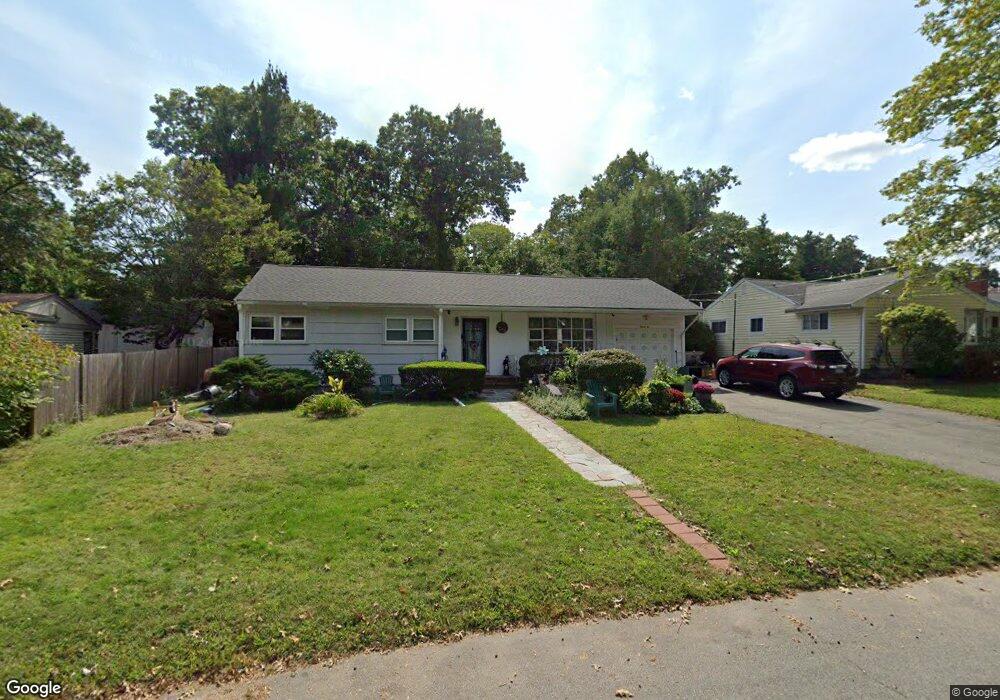
22 Marlene Ave Brockton, MA 02301
Estimated Value: $452,000 - $536,000
3
Beds
2
Baths
1,247
Sq Ft
$403/Sq Ft
Est. Value
About This Home
This home is located at 22 Marlene Ave, Brockton, MA 02301 and is currently estimated at $502,905, approximately $403 per square foot. 22 Marlene Ave is a home located in Plymouth County with nearby schools including Manthala George Jr. School, Hancock Elementary School, and Louis F Angelo Elementary School.
Ownership History
Date
Name
Owned For
Owner Type
Purchase Details
Closed on
Oct 31, 1996
Sold by
Payton David F and Payton Kathryn A
Bought by
Stanbrook Stephen C and Stanbrook Kimberly A
Current Estimated Value
Home Financials for this Owner
Home Financials are based on the most recent Mortgage that was taken out on this home.
Original Mortgage
$119,530
Interest Rate
8.07%
Mortgage Type
Purchase Money Mortgage
Create a Home Valuation Report for This Property
The Home Valuation Report is an in-depth analysis detailing your home's value as well as a comparison with similar homes in the area
Home Values in the Area
Average Home Value in this Area
Purchase History
| Date | Buyer | Sale Price | Title Company |
|---|---|---|---|
| Stanbrook Stephen C | $119,900 | -- |
Source: Public Records
Mortgage History
| Date | Status | Borrower | Loan Amount |
|---|---|---|---|
| Open | Stanbrook Stephen C | $240,000 | |
| Closed | Stanbrook Stephen C | $47,000 | |
| Closed | Stanbrook Stephen C | $119,395 | |
| Closed | Stanbrook Stephen C | $119,530 |
Source: Public Records
Tax History Compared to Growth
Tax History
| Year | Tax Paid | Tax Assessment Tax Assessment Total Assessment is a certain percentage of the fair market value that is determined by local assessors to be the total taxable value of land and additions on the property. | Land | Improvement |
|---|---|---|---|---|
| 2025 | $5,268 | $435,000 | $144,600 | $290,400 |
| 2024 | $5,018 | $417,500 | $144,600 | $272,900 |
| 2023 | $5,150 | $396,800 | $109,500 | $287,300 |
| 2022 | $4,803 | $343,800 | $99,500 | $244,300 |
| 2021 | $4,453 | $307,100 | $93,500 | $213,600 |
| 2020 | $4,216 | $278,300 | $89,700 | $188,600 |
| 2019 | $4,034 | $259,600 | $83,700 | $175,900 |
| 2018 | $3,763 | $234,300 | $83,700 | $150,600 |
| 2017 | $3,487 | $216,600 | $83,700 | $132,900 |
| 2016 | $3,547 | $204,300 | $75,800 | $128,500 |
| 2015 | $3,311 | $182,400 | $75,800 | $106,600 |
| 2014 | $3,285 | $181,200 | $75,800 | $105,400 |
Source: Public Records
Map
Nearby Homes
- 25 Monson St
- 37 West St
- 28 Fern Ave
- 48 N Belcher Ave
- 17 Moraine Place
- 20 Montauk Rd
- 67 Sycamore Ave Unit 3
- 21 Oneida Ave
- 161 Moraine St
- 72 W Elm Terrace
- 77 Colonel Bell Dr Unit 4
- 61 Fairfield St
- 141 Prospect Ave
- 175 Belmont Ave
- 281 Spring St
- 15 Byron Ave
- 190 Highland St
- 45 Briarcliff Rd
- 114 Crickett Rd
- 78 Keene St