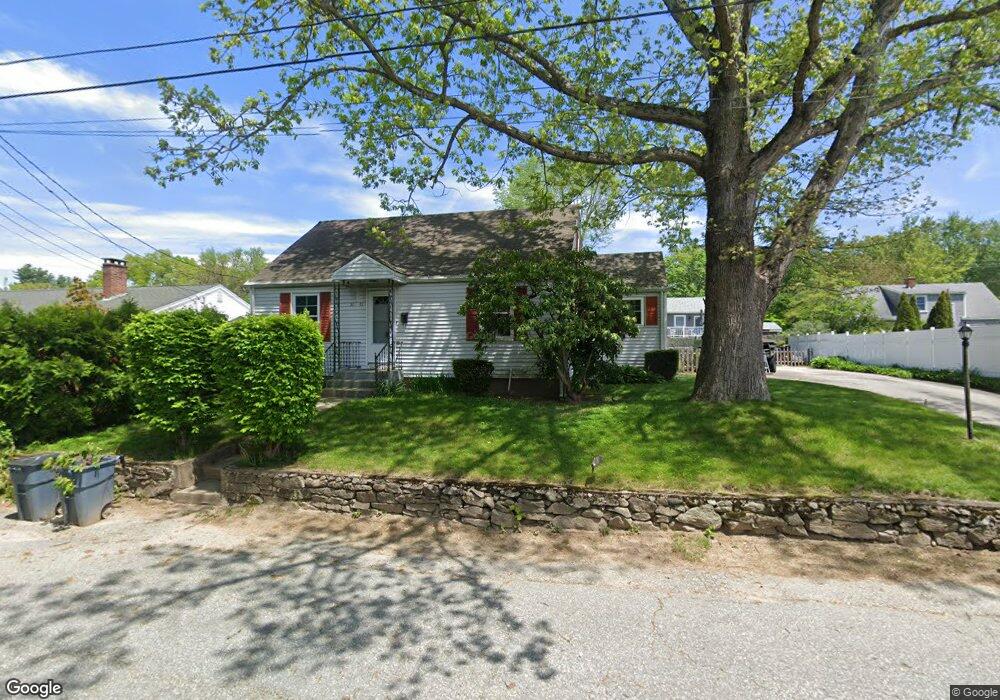
22 Marshall Cir Coventry, RI 02816
West Warwick Centre NeighborhoodEstimated Value: $352,000 - $385,000
3
Beds
1
Bath
1,200
Sq Ft
$306/Sq Ft
Est. Value
About This Home
This home is located at 22 Marshall Cir, Coventry, RI 02816 and is currently estimated at $366,755, approximately $305 per square foot. 22 Marshall Cir is a home located in Kent County with nearby schools including Alan Shawn Feinstein Ms Of Cov and Coventry High School.
Ownership History
Date
Name
Owned For
Owner Type
Purchase Details
Closed on
Oct 15, 2025
Sold by
Bloomer Irene
Bought by
Re Financial Llc
Current Estimated Value
Purchase Details
Closed on
Sep 15, 2025
Sold by
Sylvia Jason J
Bought by
Tyler Llc
Purchase Details
Closed on
Jul 18, 2024
Sold by
Bloomer Irene M Est
Bought by
S & W Holdings Llc
Purchase Details
Closed on
Oct 24, 2022
Sold by
Coventry Town Of
Bought by
Bloomer Irene M
Purchase Details
Closed on
Feb 21, 2013
Sold by
Bloomer Irene M
Bought by
Sylvia Jason J
Create a Home Valuation Report for This Property
The Home Valuation Report is an in-depth analysis detailing your home's value as well as a comparison with similar homes in the area
Home Values in the Area
Average Home Value in this Area
Purchase History
| Date | Buyer | Sale Price | Title Company |
|---|---|---|---|
| Re Financial Llc | $2,400 | -- | |
| Tyler Llc | $4,991 | -- | |
| S & W Holdings Llc | $4,826 | None Available | |
| S & W Holdings Llc | $4,826 | None Available | |
| Bloomer Irene M | -- | None Available | |
| Bloomer Irene M | -- | None Available | |
| Sylvia Jason J | -- | -- | |
| Sylvia Jason J | -- | -- |
Source: Public Records
Tax History
| Year | Tax Paid | Tax Assessment Tax Assessment Total Assessment is a certain percentage of the fair market value that is determined by local assessors to be the total taxable value of land and additions on the property. | Land | Improvement |
|---|---|---|---|---|
| 2025 | $3,966 | $246,500 | $85,800 | $160,700 |
| 2024 | $3,905 | $246,500 | $85,800 | $160,700 |
| 2023 | $3,779 | $246,500 | $85,800 | $160,700 |
| 2022 | $3,744 | $191,300 | $82,100 | $109,200 |
| 2021 | $3,711 | $191,300 | $82,100 | $109,200 |
| 2020 | $4,255 | $191,300 | $82,100 | $109,200 |
| 2019 | $3,376 | $151,800 | $55,000 | $96,800 |
| 2018 | $3,280 | $151,800 | $55,000 | $96,800 |
| 2017 | $3,185 | $151,800 | $55,000 | $96,800 |
| 2016 | $3,023 | $141,200 | $52,100 | $89,100 |
| 2015 | $2,941 | $141,200 | $52,100 | $89,100 |
| 2014 | $1,541 | $141,200 | $52,100 | $89,100 |
| 2013 | $2,581 | $138,300 | $58,100 | $80,200 |
Source: Public Records
Map
Nearby Homes
Your Personal Tour Guide
Ask me questions while you tour the home.