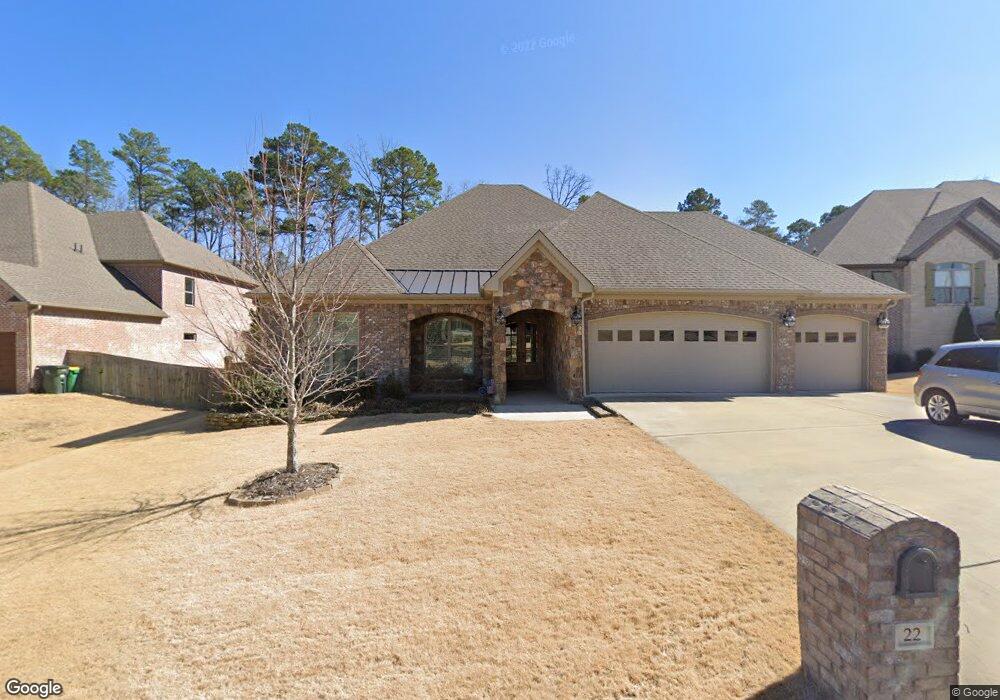
22 Mirabel Ct Little Rock, AR 72223
Chenal Valley NeighborhoodEstimated Value: $724,331 - $834,000
--
Bed
4
Baths
3,617
Sq Ft
$218/Sq Ft
Est. Value
About This Home
This home is located at 22 Mirabel Ct, Little Rock, AR 72223 and is currently estimated at $788,833, approximately $218 per square foot. 22 Mirabel Ct is a home located in Pulaski County with nearby schools including Chenal Elementary School, Joe T. Robinson Middle School, and Joe T. Robinson High School.
Ownership History
Date
Name
Owned For
Owner Type
Purchase Details
Closed on
Aug 1, 2016
Sold by
Graham Smith Construction Llc
Bought by
Calderon Vincent and Seguin Calderon Rosey
Current Estimated Value
Home Financials for this Owner
Home Financials are based on the most recent Mortgage that was taken out on this home.
Original Mortgage
$150,000
Outstanding Balance
$14,635
Interest Rate
3.56%
Mortgage Type
New Conventional
Estimated Equity
$774,198
Purchase Details
Closed on
Dec 17, 2015
Sold by
Deltic Timber Corporation and Meghreblian David V
Bought by
Graham Smith Construction Llc
Create a Home Valuation Report for This Property
The Home Valuation Report is an in-depth analysis detailing your home's value as well as a comparison with similar homes in the area
Home Values in the Area
Average Home Value in this Area
Purchase History
| Date | Buyer | Sale Price | Title Company |
|---|---|---|---|
| Calderon Vincent | $529,900 | American Abstract & Title Co | |
| Graham Smith Construction Llc | $89,000 | Lenders Title Company |
Source: Public Records
Mortgage History
| Date | Status | Borrower | Loan Amount |
|---|---|---|---|
| Open | Calderon Vincent | $150,000 |
Source: Public Records
Tax History Compared to Growth
Tax History
| Year | Tax Paid | Tax Assessment Tax Assessment Total Assessment is a certain percentage of the fair market value that is determined by local assessors to be the total taxable value of land and additions on the property. | Land | Improvement |
|---|---|---|---|---|
| 2025 | $6,453 | $112,992 | $17,400 | $95,592 |
| 2024 | $7,098 | $112,992 | $17,400 | $95,592 |
| 2023 | $7,098 | $112,992 | $17,400 | $95,592 |
| 2022 | $6,775 | $112,992 | $17,400 | $95,592 |
| 2021 | $6,503 | $100,350 | $15,600 | $84,750 |
| 2020 | $6,078 | $100,350 | $15,600 | $84,750 |
| 2019 | $6,078 | $100,350 | $15,600 | $84,750 |
| 2018 | $6,103 | $100,350 | $15,600 | $84,750 |
| 2017 | $6,103 | $100,350 | $15,600 | $84,750 |
| 2016 | $1,029 | $16,000 | $16,000 | $0 |
Source: Public Records
Map
Nearby Homes