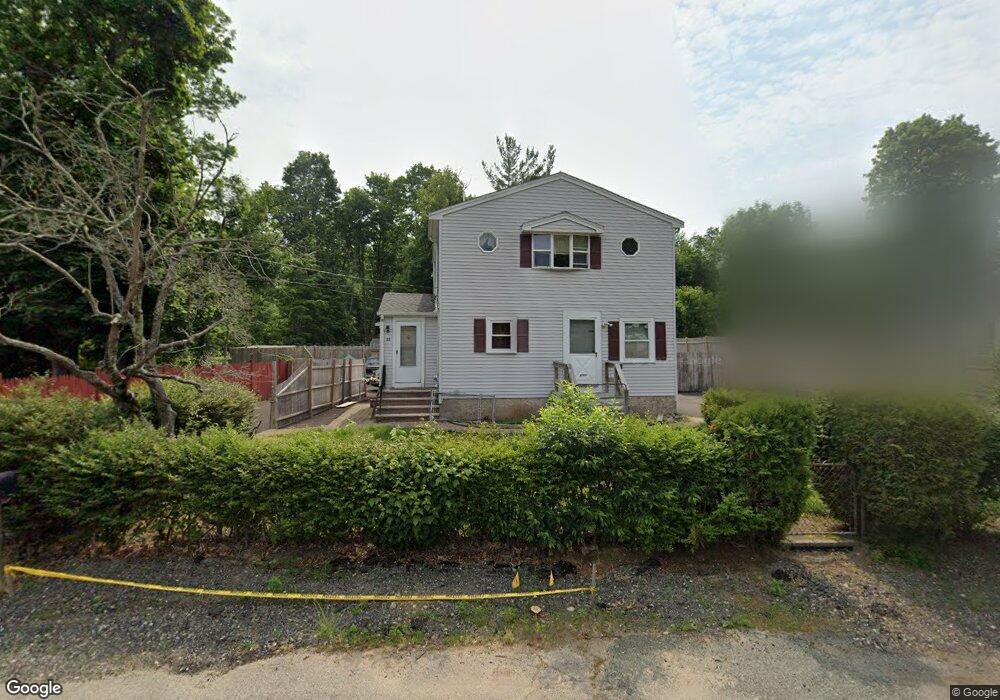
22 Moore St Brockton, MA 02302
Campello NeighborhoodEstimated Value: $442,000 - $463,164
2
Beds
1
Bath
1,146
Sq Ft
$398/Sq Ft
Est. Value
About This Home
This home is located at 22 Moore St, Brockton, MA 02302 and is currently estimated at $455,541, approximately $397 per square foot. 22 Moore St is a home located in Plymouth County with nearby schools including Davis K-8 School, John F. Kennedy Elementary School, and South Middle School.
Ownership History
Date
Name
Owned For
Owner Type
Purchase Details
Closed on
Aug 3, 1998
Sold by
Centeno Kimberly D
Bought by
Breton Jeffrey W
Current Estimated Value
Purchase Details
Closed on
May 3, 1995
Sold by
Johnson Theresa A Est
Bought by
Centeno Efrain and Dube Kimberly A
Create a Home Valuation Report for This Property
The Home Valuation Report is an in-depth analysis detailing your home's value as well as a comparison with similar homes in the area
Home Values in the Area
Average Home Value in this Area
Purchase History
| Date | Buyer | Sale Price | Title Company |
|---|---|---|---|
| Breton Jeffrey W | $75,000 | -- | |
| Centeno Efrain | $60,700 | -- |
Source: Public Records
Mortgage History
| Date | Status | Borrower | Loan Amount |
|---|---|---|---|
| Open | Centeno Efrain | $166,000 | |
| Closed | Centeno Efrain | $171,000 | |
| Closed | Centeno Efrain | $116,250 |
Source: Public Records
Tax History Compared to Growth
Tax History
| Year | Tax Paid | Tax Assessment Tax Assessment Total Assessment is a certain percentage of the fair market value that is determined by local assessors to be the total taxable value of land and additions on the property. | Land | Improvement |
|---|---|---|---|---|
| 2025 | $4,765 | $393,500 | $136,900 | $256,600 |
| 2024 | $4,476 | $372,400 | $136,900 | $235,500 |
| 2023 | $4,623 | $356,200 | $102,300 | $253,900 |
| 2022 | $4,076 | $291,800 | $92,900 | $198,900 |
| 2021 | $4,018 | $277,100 | $76,800 | $200,300 |
| 2020 | $3,733 | $246,400 | $72,400 | $174,000 |
| 2019 | $3,486 | $224,300 | $70,100 | $154,200 |
| 2018 | $3,321 | $206,800 | $70,100 | $136,700 |
| 2017 | $3,241 | $201,300 | $70,100 | $131,200 |
| 2016 | $2,851 | $164,200 | $67,900 | $96,300 |
| 2015 | $2,870 | $158,100 | $67,900 | $90,200 |
| 2014 | $2,957 | $163,100 | $67,900 | $95,200 |
Source: Public Records
Map
Nearby Homes
- 163 S Leyden St
- 44 Baker St
- 112 Hillside Ave
- 54 Ferris Ave
- 223 Clinton St Unit 10
- 223 Clinton St Unit 3
- 34 Carl Ave
- 28 Wallace St
- 12 Paulin Ave
- 103 Clinton St
- 70 Carlisle St
- 265 Summer St
- 229 Sinclair Rd
- 221 Sinclair Rd
- 65 Tremont St
- 115 Market St
- 936 Warren Ave
- 16 Yuba Cir
- 977 Warren Ave
- 122 Sinclair Rd