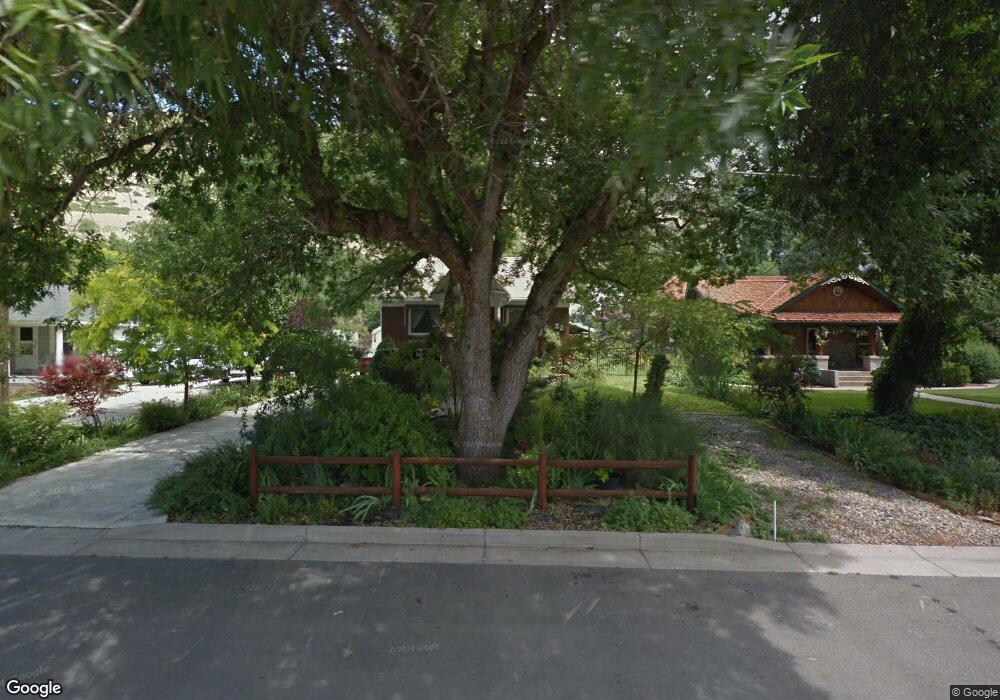
22 N 200 E Farmington, UT 84025
Estimated Value: $376,000 - $435,000
3
Beds
1
Bath
1,846
Sq Ft
$225/Sq Ft
Est. Value
About This Home
This home is located at 22 N 200 E, Farmington, UT 84025 and is currently estimated at $414,819, approximately $224 per square foot. 22 N 200 E is a home located in Davis County with nearby schools including Farmington Elementary School, Farmington High, and Farmington Junior High School.
Ownership History
Date
Name
Owned For
Owner Type
Purchase Details
Closed on
Jul 8, 2024
Sold by
Shirley K Kirby Family Trust and Kirby Shirley K
Bought by
Fletcher Rachel
Current Estimated Value
Home Financials for this Owner
Home Financials are based on the most recent Mortgage that was taken out on this home.
Original Mortgage
$339,750
Outstanding Balance
$335,653
Interest Rate
6.94%
Mortgage Type
New Conventional
Estimated Equity
$79,166
Purchase Details
Closed on
Aug 27, 2018
Sold by
Kirby Shirley K
Bought by
Kirby Shirley K and Donaldson Cathie
Purchase Details
Closed on
Jul 26, 1999
Sold by
Kirby Gerald B
Bought by
Kirby Gerald B and Kirby Shirley G
Home Financials for this Owner
Home Financials are based on the most recent Mortgage that was taken out on this home.
Original Mortgage
$100,000
Interest Rate
7.64%
Purchase Details
Closed on
Mar 5, 1998
Sold by
Donaldson John A and Donaldson Shirley G
Bought by
Kirby Gerald B and Kirby Shirley G
Create a Home Valuation Report for This Property
The Home Valuation Report is an in-depth analysis detailing your home's value as well as a comparison with similar homes in the area
Home Values in the Area
Average Home Value in this Area
Purchase History
| Date | Buyer | Sale Price | Title Company |
|---|---|---|---|
| Fletcher Rachel | -- | Capstone Title | |
| Kirby Shirley K | -- | None Available | |
| Kirby Shirley K | -- | None Available | |
| Kirby Gerald B | -- | Security Title Ins Agency | |
| Kirby Gerald B | -- | Security Title Ins Agency | |
| Kirby Gerald B | -- | -- |
Source: Public Records
Mortgage History
| Date | Status | Borrower | Loan Amount |
|---|---|---|---|
| Open | Fletcher Rachel | $339,750 | |
| Previous Owner | Kirby Gerald B | $100,000 |
Source: Public Records
Tax History Compared to Growth
Tax History
| Year | Tax Paid | Tax Assessment Tax Assessment Total Assessment is a certain percentage of the fair market value that is determined by local assessors to be the total taxable value of land and additions on the property. | Land | Improvement |
|---|---|---|---|---|
| 2024 | $2,195 | $219,450 | $184,898 | $34,552 |
| 2023 | $221 | $384,000 | $224,158 | $159,842 |
| 2022 | $353 | $219,450 | $123,821 | $95,629 |
| 2021 | $382 | $303,000 | $173,701 | $129,299 |
| 2020 | $433 | $271,000 | $145,874 | $125,126 |
| 2019 | $288 | $236,000 | $145,511 | $90,489 |
| 2018 | $271 | $221,000 | $143,646 | $77,354 |
| 2016 | $340 | $106,150 | $62,524 | $43,626 |
| 2015 | $1,412 | $99,000 | $62,524 | $36,476 |
| 2014 | $368 | $109,539 | $52,104 | $57,435 |
| 2013 | -- | $108,062 | $47,352 | $60,710 |
Source: Public Records
Map
Nearby Homes
- 79 S 300 E
- 334 E Cottrell Ln
- 13 Sunset Dr
- 170 N Main St
- 292 N Flag Rock Dr
- 21 N 100 W Unit 3
- 139 E 400 N
- 2 Grayson Way N Unit 11
- 1504 W Kiera Court Ct N Unit 150
- 38 S 300 W
- 69 W Grove Creek Cir
- 434 W 450 S Unit 815
- 1460 W 550 N Unit 166
- 372 W Clark Cir
- 52 N 400 W
- 250 S 200 W
- 247 Paulette Way
- 442 W Randys Ct Unit 808
- 432 E Greystone Dr Unit 308
- 431 E Greystone Dr