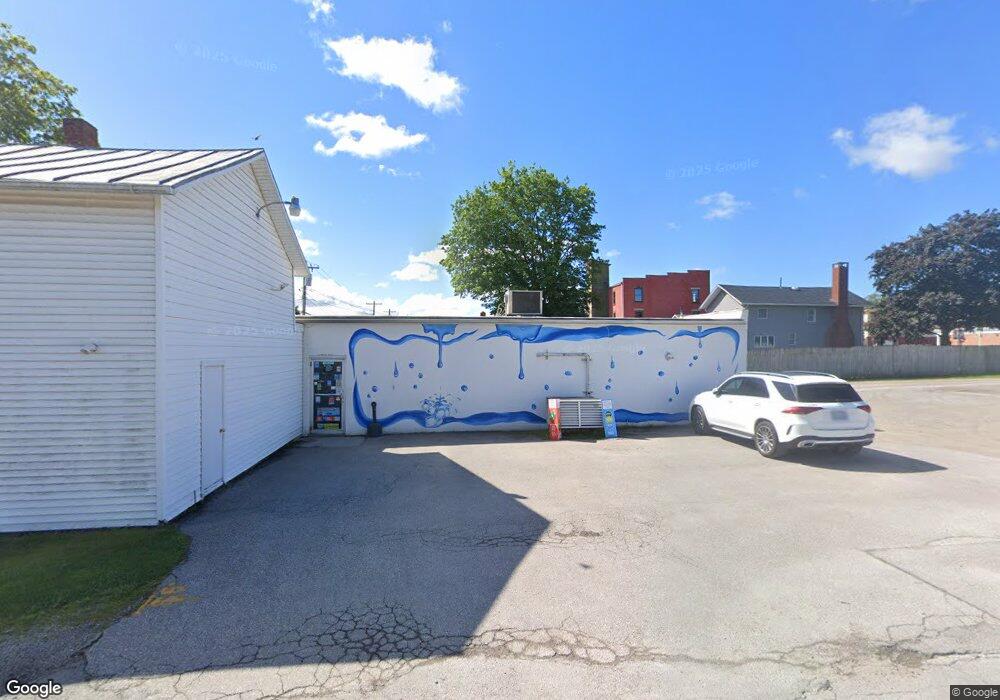
22 N Main St Monroeville, OH 44847
Estimated Value: $190,893
Studio
--
Bath
2,400
Sq Ft
$80/Sq Ft
Est. Value
About This Home
This home is located at 22 N Main St, Monroeville, OH 44847 and is currently priced at $190,893, approximately $79 per square foot. 22 N Main St is a home located in Huron County with nearby schools including Monroeville Elementary School, Monroeville High School, and St Joseph Catholic School.
Ownership History
Date
Name
Owned For
Owner Type
Purchase Details
Closed on
Sep 26, 2022
Sold by
Belle And Mason Properties Llc
Bought by
Jasbir Of Ohio Llc
Current Estimated Value
Purchase Details
Closed on
Apr 8, 2013
Bought by
Belle And Mason Properties Llc
Purchase Details
Closed on
Feb 1, 2008
Bought by
Flicker Enterprises Llc
Purchase Details
Closed on
Jan 5, 1999
Sold by
Vanfleet Dennis A
Bought by
Tallman Cynthia S
Home Financials for this Owner
Home Financials are based on the most recent Mortgage that was taken out on this home.
Original Mortgage
$62,000
Interest Rate
6.95%
Mortgage Type
Commercial
Purchase Details
Closed on
Jun 17, 1993
Bought by
Vanfleet Dennis A
Create a Home Valuation Report for This Property
The Home Valuation Report is an in-depth analysis detailing your home's value as well as a comparison with similar homes in the area
Purchase History
| Date | Buyer | Sale Price | Title Company |
|---|---|---|---|
| Jasbir Of Ohio Llc | $100,000 | Midland Title | |
| Belle And Mason Properties Llc | -- | -- | |
| Belle & Mason Properties Llc | -- | Attorney | |
| Flicker Enterprises Llc | $150,000 | -- | |
| Tallman Cynthia S | $90,000 | -- | |
| Vanfleet Dennis A | -- | -- |
Source: Public Records
Mortgage History
| Date | Status | Borrower | Loan Amount |
|---|---|---|---|
| Previous Owner | Tallman Cynthia S | $62,000 |
Source: Public Records
Map
Nearby Homes
Your Personal Tour Guide
Ask me questions while you tour the home.