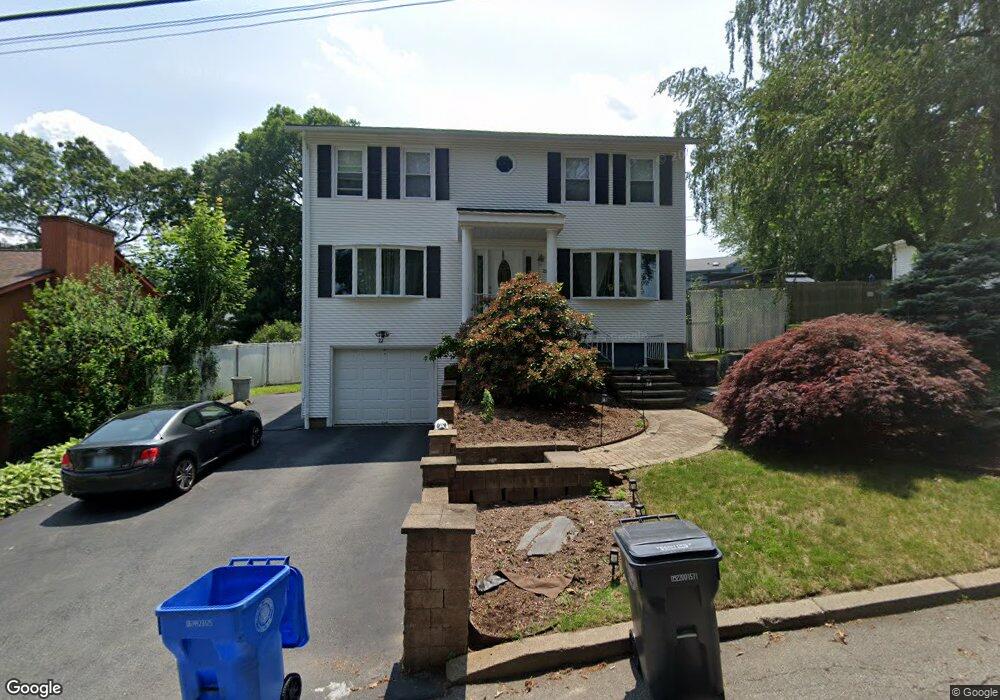
22 N View Ave Cranston, RI 02920
Budlong NeighborhoodEstimated Value: $525,000 - $590,000
3
Beds
3
Baths
2,500
Sq Ft
$225/Sq Ft
Est. Value
About This Home
This home is located at 22 N View Ave, Cranston, RI 02920 and is currently estimated at $561,395, approximately $224 per square foot. 22 N View Ave is a home located in Providence County with nearby schools including Woodridge Elementary School, Western Hills Middle School, and Cranston High School West.
Ownership History
Date
Name
Owned For
Owner Type
Purchase Details
Closed on
Dec 31, 2014
Sold by
Krikorian Christopher and Krikorian Violet M
Bought by
Krikorian Ida D
Current Estimated Value
Home Financials for this Owner
Home Financials are based on the most recent Mortgage that was taken out on this home.
Original Mortgage
$220,000
Outstanding Balance
$166,994
Interest Rate
3.99%
Estimated Equity
$394,401
Create a Home Valuation Report for This Property
The Home Valuation Report is an in-depth analysis detailing your home's value as well as a comparison with similar homes in the area
Home Values in the Area
Average Home Value in this Area
Purchase History
| Date | Buyer | Sale Price | Title Company |
|---|---|---|---|
| Krikorian Ida D | $275,000 | -- |
Source: Public Records
Mortgage History
| Date | Status | Borrower | Loan Amount |
|---|---|---|---|
| Open | Krikorian Ida D | $220,000 |
Source: Public Records
Tax History
| Year | Tax Paid | Tax Assessment Tax Assessment Total Assessment is a certain percentage of the fair market value that is determined by local assessors to be the total taxable value of land and additions on the property. | Land | Improvement |
|---|---|---|---|---|
| 2025 | $6,361 | $458,300 | $120,500 | $337,800 |
| 2024 | $6,237 | $458,300 | $120,500 | $337,800 |
| 2023 | $6,040 | $319,600 | $79,300 | $240,300 |
| 2022 | $5,916 | $319,600 | $79,300 | $240,300 |
| 2021 | $5,753 | $319,600 | $79,300 | $240,300 |
| 2020 | $5,575 | $268,400 | $75,600 | $192,800 |
| 2019 | $5,575 | $268,400 | $75,600 | $192,800 |
| 2018 | $5,446 | $268,400 | $75,600 | $192,800 |
| 2017 | $5,866 | $255,700 | $68,000 | $187,700 |
| 2016 | $5,740 | $255,700 | $68,000 | $187,700 |
| 2015 | $5,740 | $255,700 | $68,000 | $187,700 |
| 2014 | $5,246 | $229,700 | $68,000 | $161,700 |
Source: Public Records
Map
Nearby Homes
Your Personal Tour Guide
Ask me questions while you tour the home.