Estimated Value: $1,460,000 - $1,647,000
3
Beds
4
Baths
2,952
Sq Ft
$518/Sq Ft
Est. Value
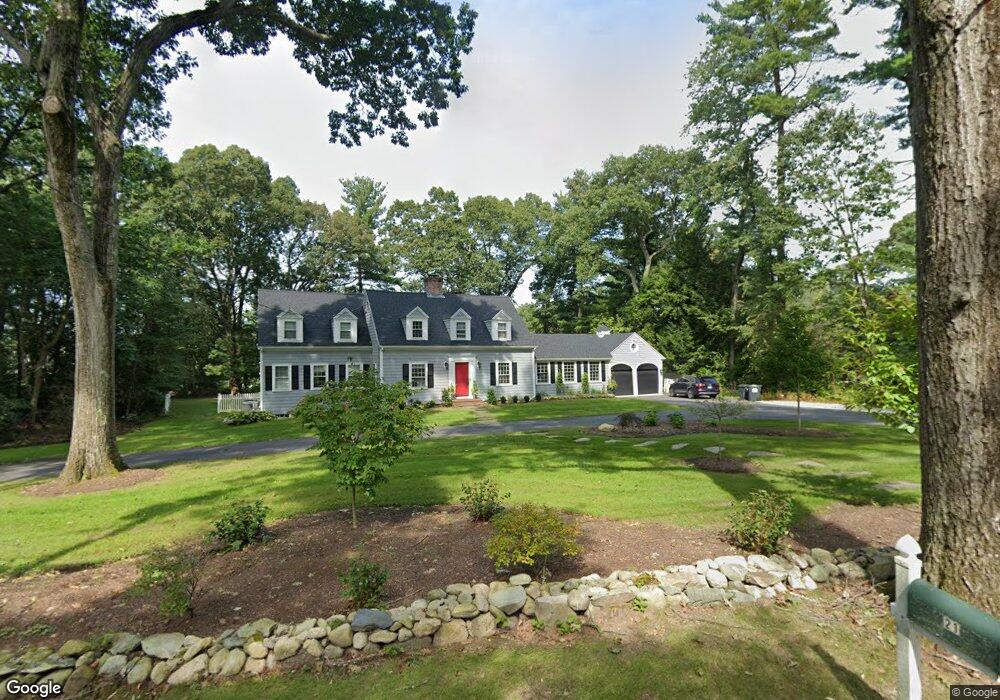
About This Home
This home is located at 22 Normandie Rd, Dover, MA 02030 and is currently estimated at $1,528,109, approximately $517 per square foot. 22 Normandie Rd is a home located in Norfolk County with nearby schools including Chickering Elementary School, Dover-Sherborn Regional Middle School, and Dover-Sherborn Regional High School.
Ownership History
Date
Name
Owned For
Owner Type
Purchase Details
Closed on
Nov 2, 2015
Sold by
Slawsby Todd D and Slawsby Amelia E
Bought by
Slawby Rt
Current Estimated Value
Purchase Details
Closed on
Dec 5, 2007
Sold by
Walker Katharine A and Walker Laurence G
Bought by
Slawsby Amelia E and Slawsby Todd D
Home Financials for this Owner
Home Financials are based on the most recent Mortgage that was taken out on this home.
Original Mortgage
$275,000
Interest Rate
6.37%
Mortgage Type
Purchase Money Mortgage
Create a Home Valuation Report for This Property
The Home Valuation Report is an in-depth analysis detailing your home's value as well as a comparison with similar homes in the area
Home Values in the Area
Average Home Value in this Area
Purchase History
| Date | Buyer | Sale Price | Title Company |
|---|---|---|---|
| Slawby Rt | -- | -- | |
| Slawsby Amelia E | $865,000 | -- |
Source: Public Records
Mortgage History
| Date | Status | Borrower | Loan Amount |
|---|---|---|---|
| Previous Owner | Slawsby Amelia E | $275,000 |
Source: Public Records
Tax History
| Year | Tax Paid | Tax Assessment Tax Assessment Total Assessment is a certain percentage of the fair market value that is determined by local assessors to be the total taxable value of land and additions on the property. | Land | Improvement |
|---|---|---|---|---|
| 2025 | $14,374 | $1,275,400 | $645,300 | $630,100 |
| 2024 | $13,769 | $1,256,300 | $626,200 | $630,100 |
| 2023 | $13,321 | $1,092,800 | $557,400 | $535,400 |
| 2022 | $12,773 | $1,028,400 | $538,400 | $490,000 |
| 2021 | $13,256 | $1,028,400 | $538,400 | $490,000 |
| 2020 | $12,966 | $1,009,800 | $538,400 | $471,400 |
| 2019 | $13,057 | $1,009,800 | $538,400 | $471,400 |
| 2018 | $11,765 | $916,300 | $478,400 | $437,900 |
| 2017 | $11,461 | $878,200 | $440,300 | $437,900 |
| 2016 | $11,428 | $887,300 | $440,300 | $447,000 |
| 2015 | $10,851 | $854,400 | $419,300 | $435,100 |
Source: Public Records
Map
Nearby Homes
- 25 Bretton Rd
- 62 Walpole St
- 29 Rolling Ln
- 49 Powisset St
- 1 Old Colony Dr
- 93 Walpole St
- 52 Willow St
- 1 Mill St
- 62 Claybrook Rd
- 60 Claybrook Rd
- 8 Crestview Rd
- 157 Centre St
- 24 Moseley Ave
- 1780 Central Ave
- 34 Stratford Rd
- 29 Hartford St
- 365 Charles River St
- 4 Dancer Farm Dr
- 26 Longmeadow Dr
- 37 Carleton Dr
Your Personal Tour Guide
Ask me questions while you tour the home.