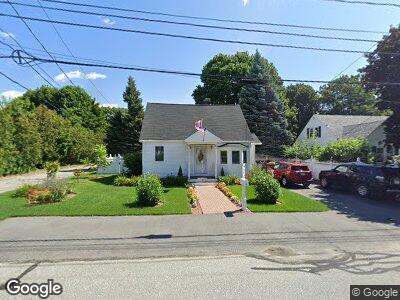
22 Orange St Woburn, MA 01801
Walnut Hill NeighborhoodEstimated Value: $678,000 - $771,000
3
Beds
2
Baths
1,626
Sq Ft
$442/Sq Ft
Est. Value
About This Home
This home is located at 22 Orange St, Woburn, MA 01801 and is currently estimated at $718,555, approximately $441 per square foot. 22 Orange St is a home located in Middlesex County with nearby schools including Goodyear Elementary School, John F. Kennedy Middle School, and Woburn High School.
Ownership History
Date
Name
Owned For
Owner Type
Purchase Details
Closed on
Mar 17, 2023
Sold by
Jackson Marie C and Jackson Paul A
Bought by
Paul & M Jackson 2023 Ret and Jackson
Current Estimated Value
Purchase Details
Closed on
Jan 1, 1983
Bought by
Jackson Paul A
Create a Home Valuation Report for This Property
The Home Valuation Report is an in-depth analysis detailing your home's value as well as a comparison with similar homes in the area
Home Values in the Area
Average Home Value in this Area
Purchase History
| Date | Buyer | Sale Price | Title Company |
|---|---|---|---|
| Paul & M Jackson 2023 Ret | -- | None Available | |
| Paul & M Jackson 2023 Ret | -- | None Available | |
| Jackson Paul A | -- | -- |
Source: Public Records
Mortgage History
| Date | Status | Borrower | Loan Amount |
|---|---|---|---|
| Previous Owner | Jackson Paul A | $50,000 | |
| Previous Owner | Jackson Marie C | $15,000 | |
| Previous Owner | Jackson Marie C | $166,050 | |
| Previous Owner | Jackson Paul A | $175,000 | |
| Previous Owner | Jackson Paul A | $144,000 | |
| Previous Owner | Jackson Paul A | $25,000 |
Source: Public Records
Tax History Compared to Growth
Tax History
| Year | Tax Paid | Tax Assessment Tax Assessment Total Assessment is a certain percentage of the fair market value that is determined by local assessors to be the total taxable value of land and additions on the property. | Land | Improvement |
|---|---|---|---|---|
| 2025 | $5,300 | $620,600 | $311,700 | $308,900 |
| 2024 | $4,766 | $591,300 | $296,900 | $294,400 |
| 2023 | $4,509 | $518,300 | $269,900 | $248,400 |
| 2022 | $4,375 | $468,400 | $234,700 | $233,700 |
| 2021 | $4,129 | $442,500 | $223,500 | $219,000 |
| 2020 | $3,941 | $422,900 | $223,500 | $199,400 |
| 2019 | $3,969 | $417,800 | $212,900 | $204,900 |
| 2018 | $3,781 | $382,300 | $195,300 | $187,000 |
| 2017 | $3,542 | $356,300 | $186,000 | $170,300 |
| 2016 | $3,380 | $336,300 | $173,800 | $162,500 |
| 2015 | $3,252 | $319,800 | $162,500 | $157,300 |
| 2014 | $3,056 | $292,700 | $162,500 | $130,200 |
Source: Public Records
Map
Nearby Homes
- 1 Carter Rd
- 107 Pine St Unit 107
- 12 Utica St
- 1 Albert Dr Unit 2
- 6 Stratton Dr Unit 410
- 6 Stratton Dr Unit 407
- 6 Stratton Dr Unit 208
- 7 Mason Way Unit 69
- 5 Mason Way Unit 68
- 509 William St
- 4 Sherman Place Ct
- 11 Mason Way Unit 71
- 2 Mason Way Unit 65
- 6 Mason Way Unit 63
- 8 Mason Way Unit 62
- 18 Elizabeth Rd
- 703 Washington St
- 2 Fox Rd
- 117 Montvale Ave
- 15 Churchill Rd