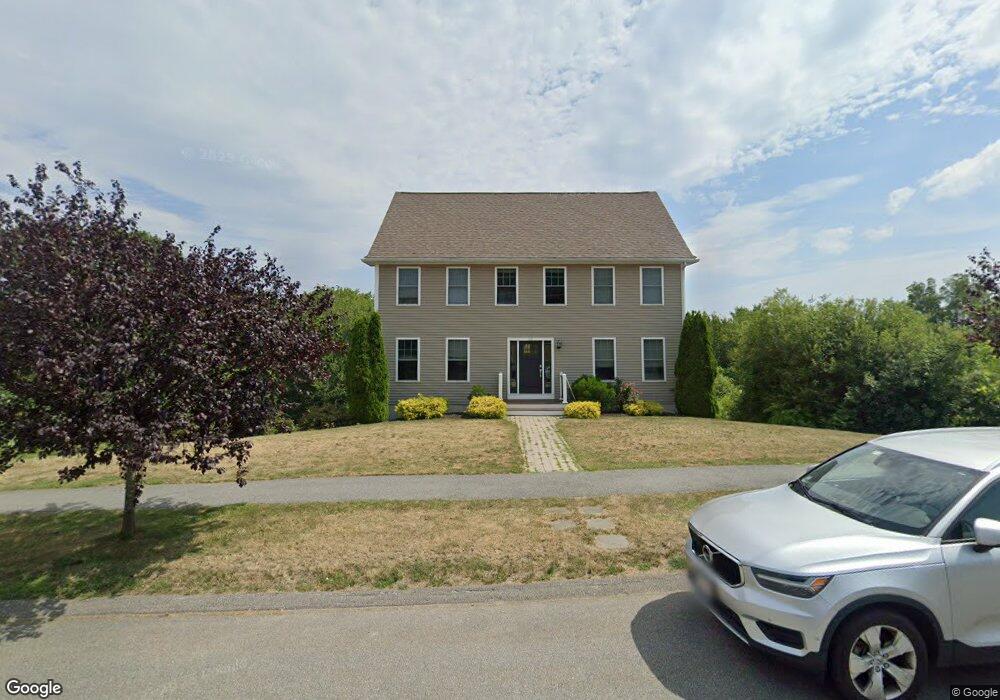
22 Overlook Dr Danvers, MA 01923
Estimated Value: $954,000 - $1,101,000
4
Beds
3
Baths
2,128
Sq Ft
$490/Sq Ft
Est. Value
About This Home
This home is located at 22 Overlook Dr, Danvers, MA 01923 and is currently estimated at $1,043,716, approximately $490 per square foot. 22 Overlook Dr is a home located in Essex County with nearby schools including Danvers High School, The Saints Academy, and North Shore Christian School.
Ownership History
Date
Name
Owned For
Owner Type
Purchase Details
Closed on
Jul 21, 2011
Sold by
Folly Hill Danvers Llc
Bought by
Liporto Ernie and Liporto Linda
Current Estimated Value
Home Financials for this Owner
Home Financials are based on the most recent Mortgage that was taken out on this home.
Original Mortgage
$330,000
Interest Rate
4.49%
Mortgage Type
Purchase Money Mortgage
Create a Home Valuation Report for This Property
The Home Valuation Report is an in-depth analysis detailing your home's value as well as a comparison with similar homes in the area
Home Values in the Area
Average Home Value in this Area
Purchase History
| Date | Buyer | Sale Price | Title Company |
|---|---|---|---|
| Liporto Ernie | $430,000 | -- |
Source: Public Records
Mortgage History
| Date | Status | Borrower | Loan Amount |
|---|---|---|---|
| Open | Liporto Ernie | $330,000 | |
| Closed | Liporto Ernie | $330,000 |
Source: Public Records
Tax History
| Year | Tax Paid | Tax Assessment Tax Assessment Total Assessment is a certain percentage of the fair market value that is determined by local assessors to be the total taxable value of land and additions on the property. | Land | Improvement |
|---|---|---|---|---|
| 2025 | $10,123 | $921,100 | $447,200 | $473,900 |
| 2024 | $9,850 | $886,600 | $420,200 | $466,400 |
| 2023 | $9,488 | $807,500 | $379,600 | $427,900 |
| 2022 | $9,148 | $722,600 | $325,600 | $397,000 |
| 2021 | $8,807 | $659,700 | $312,100 | $347,600 |
| 2020 | $8,830 | $676,100 | $297,300 | $378,800 |
| 2019 | $8,308 | $625,600 | $258,100 | $367,500 |
| 2018 | $8,106 | $598,700 | $258,100 | $340,600 |
| 2017 | $8,168 | $575,600 | $258,100 | $317,500 |
| 2016 | $8,050 | $566,900 | $258,100 | $308,800 |
| 2015 | $7,871 | $527,900 | $237,800 | $290,100 |
Source: Public Records
Map
Nearby Homes
- 44 Foster St
- 59 Riverview Ave
- 13 Giles Ave Unit 2
- 61 Ellsworth Ave
- 55 Burley St
- 34 Bayview Terrace Unit 5
- 50 Balch St Unit 300
- 50 Balch St Unit 205
- 147 High St
- 14 Grove St
- 6 Mcdewell Ave Unit 4
- 14 Chase St
- 29 Conant St
- 76 Water St
- 6 Grant St
- 20 Central Ave
- 35 High St Unit 3D
- 2 Chapel Rd
- 10 Cottage Ave
- 123 Livingstone Ave
Your Personal Tour Guide
Ask me questions while you tour the home.